Vertical Solutions Forecast – Innovations and October P&L
A summary of innovations (Market Stress, Trend Day/Range Day forecasting) and the October and cumulative P&Ls,
–h
Henry Carstens
Vertical Solutions
cell: 503-701-5741
mail to: carstens@verticalsolutions.com
www.verticalsolutions.com
———-
Innovations
Expect more trades that exit based on Market Stress retracements from overbought/sold back to neutral (+/-1)
Expect more short term trades as markets get more extended and the risk of longer holding periods increases.
Expect to see more markets traded as Market Stress gives us insight into opportunities.
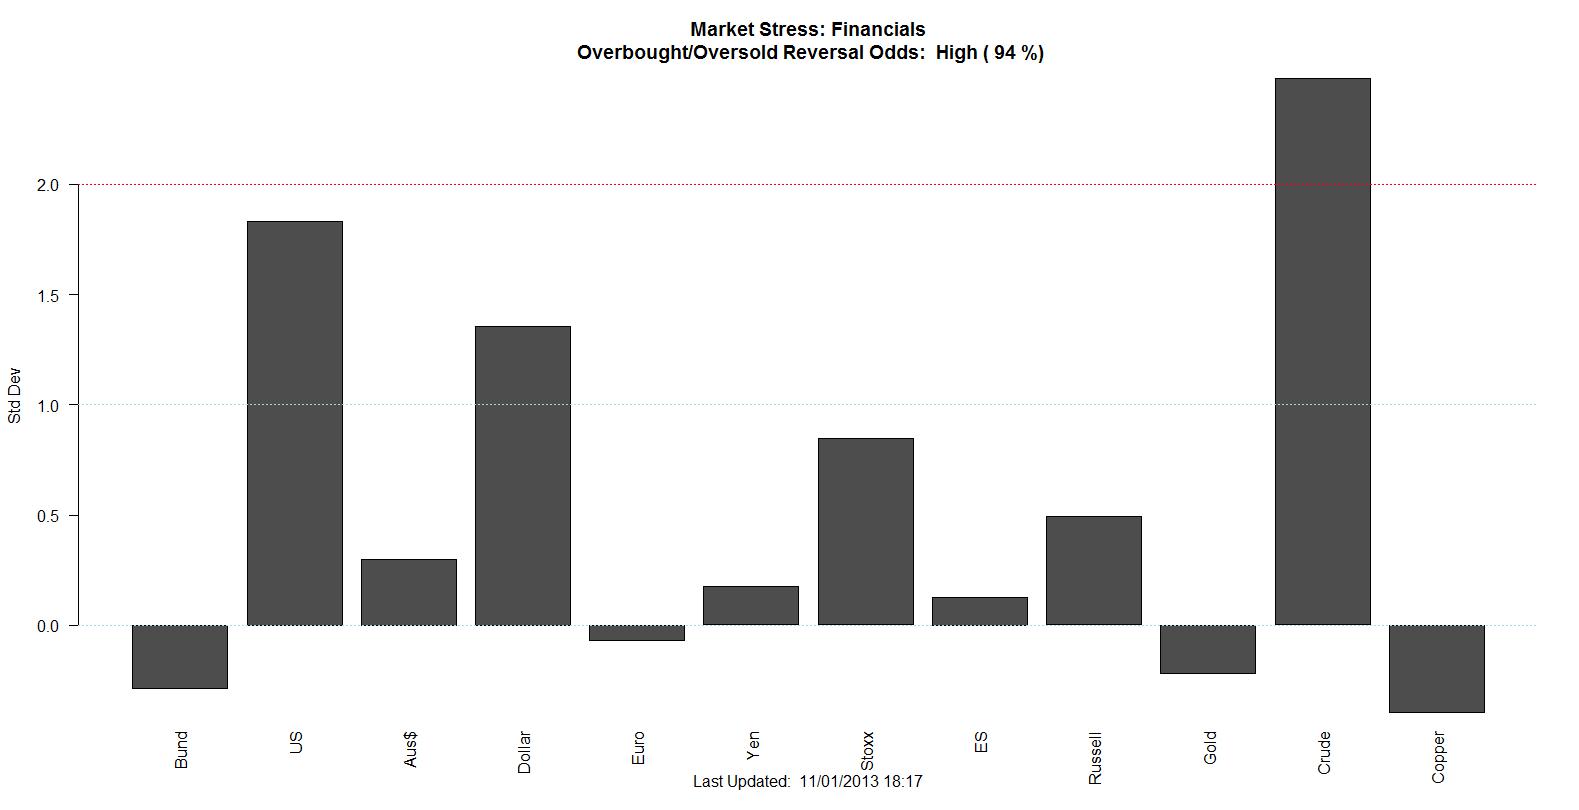
Use the website to identify intraday trading opportunities you can combine w/ your own work: Markets w/ Stress levels above +2 are most like to reverse on Rangebound days. When you see a lot of markets w/ Stress levels above 2, it’s probably a trend day.
The continuous intraday Trend Day/Range Day forecast is improved. (see Market Stress chart at end)
An Agriculture model is coming in January. ETF and individual stock models to follow.
What do you need?
Don’t hesitate to ask for studies or tell us what would help you the most. It’s why we’re here. Really.
———
Oct P&L
October ended with 89.4% win rate after integrating intraday Market Stress as a filter –
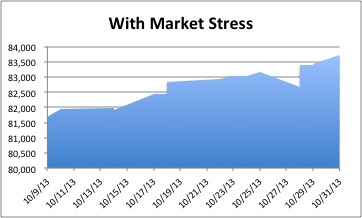
November and December will help us further gauge Market Stress.
Expect forecasts to follow the October model through the end of year.
We are finding more trades in more markets based on the three Market Stress models of Financials, Currencies and Energy.
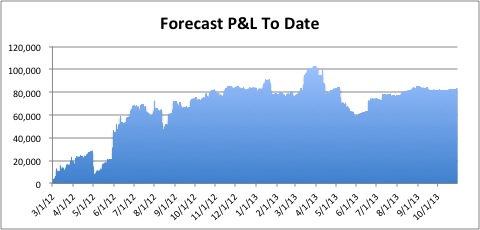
Cumulative P&L
The Forecast is up 5.0%/yr un-leveraged but has been flat for the last 12 months.
Some of the big 2013 drawdown can be attributed to a single gold trade in April.
Regardless, the Market Stress innovation is timely…
| Acct Bal | $1,000,000 | |
| Date | $/contract | %/contract |
| Mar-12 | $20,839 | 2.1% |
| Apr-12 | $8,958 | 0.9% |
| May-12 | $16,796 | 1.7% |
| Jun-12 | $21,020 | 2.1% |
| Jul-12 | ($1,378) | -0.1% |
| Aug-12 | $6,338 | 0.6% |
| Sep-12 | $1,825 | 0.2% |
| Oct-12 | $8,771 | 0.9% |
| Nov-12 | $1,303 | 0.1% |
| Dec-12 | $284 | 0.0% |
| Jan-13 | ($5,382) | -0.5% |
| Feb-13 | ($2,706) | -0.3% |
| Mar-13 | $26,198 | 2.6% |
| Apr-13 | ($19,461) | -1.9% |
| May-13 | ($23,521) | -2.4% |
| Jun-13 | $14,514 | 1.5% |
| Jul-13 | $3,398 | 0.3% |
| Aug-13 | $7,250 | 0.7% |
| Sep-13 | ($3,202) | -0.3% |
| Oct-13 | $1,881 | 0.2% |
| Gross | $83,726 | 8.4% |
| Avg/mo. | $4,186 | 0.5% |
| Avg/yr | $50,236 | 5.0% |
| % Profitable | 70% | |
| Std Dev/mo | $12,471 | |
| z | 1.50 | |
———-
Market Stress – Trend Days and Rangebound Days
The Trend Day/Range Day forecast is updated continuously in the title of the Financials Market Stress chart
The Trend Day/Range Day forecast indicates which intraday trading strategy, reversion or trend following, will work best. Because the markets are so highly correlated now, the designation applies to all the markets, not just that the SP.
Market Stress w/ Trend Day/Rangebound Day odds is the second line of title. “…Reversal Odds: High (94%) in the example below.