Three Charts, an Idea and a Trading System, 04/20/08
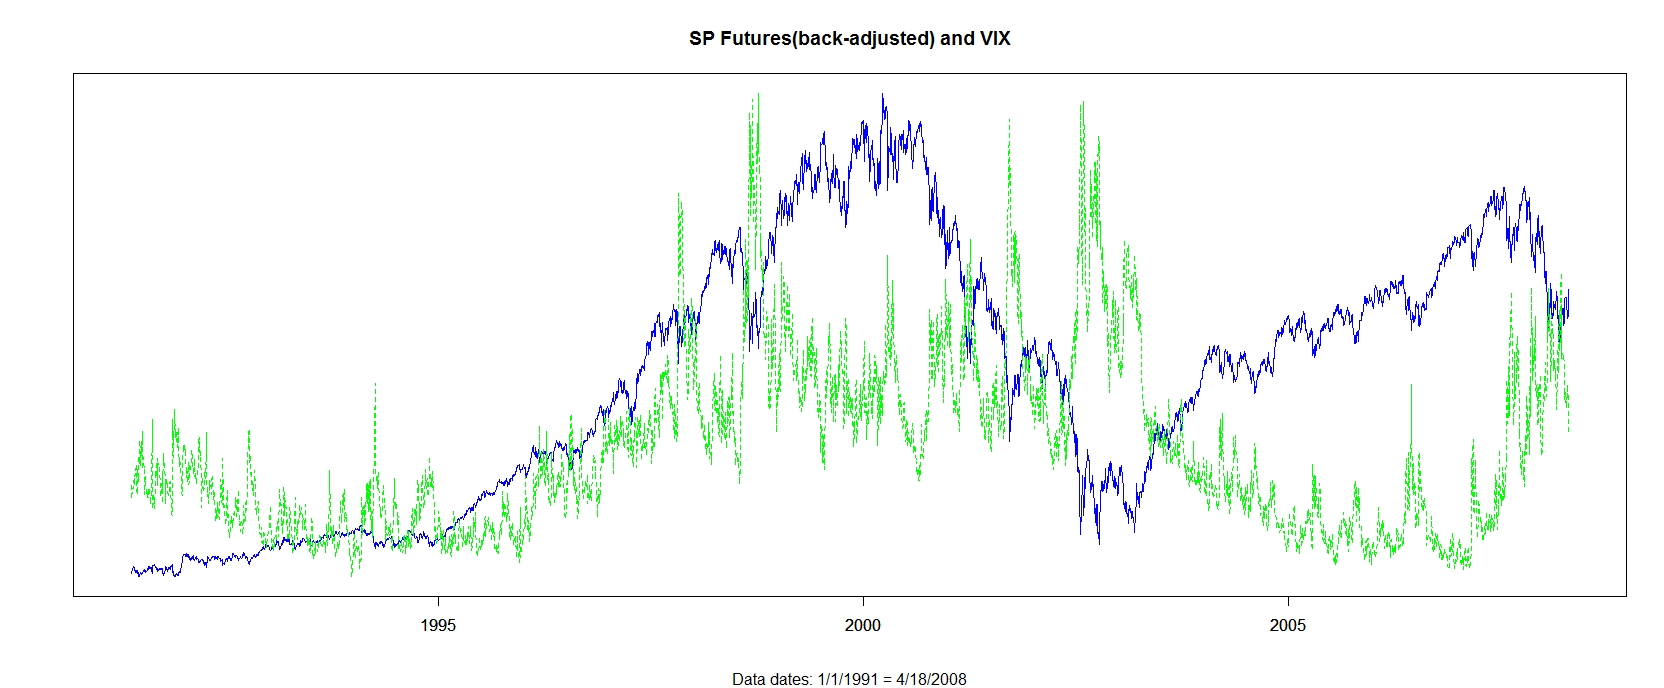
S&P and VIX, Chart 1
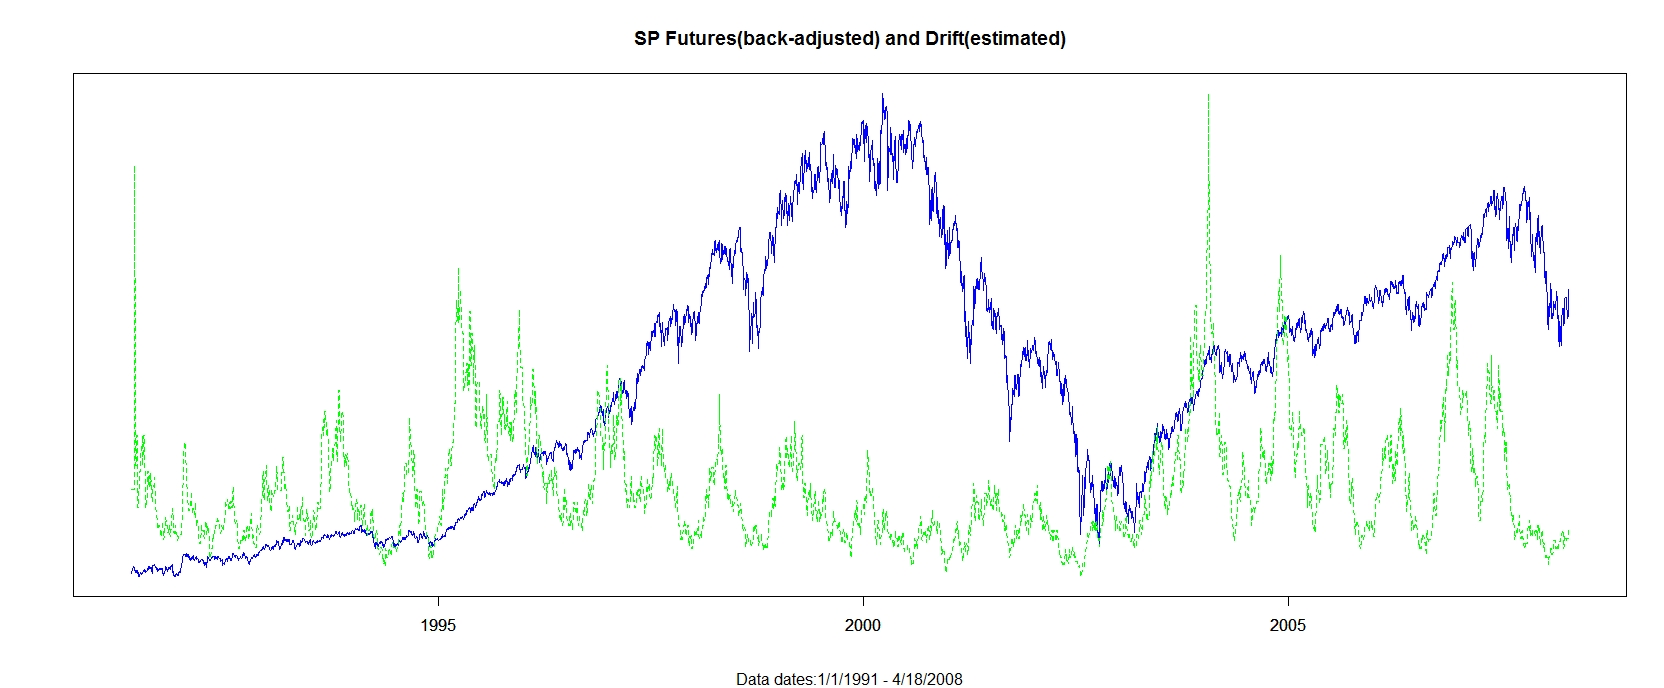
S&P and Estimated Drift, Chart 2
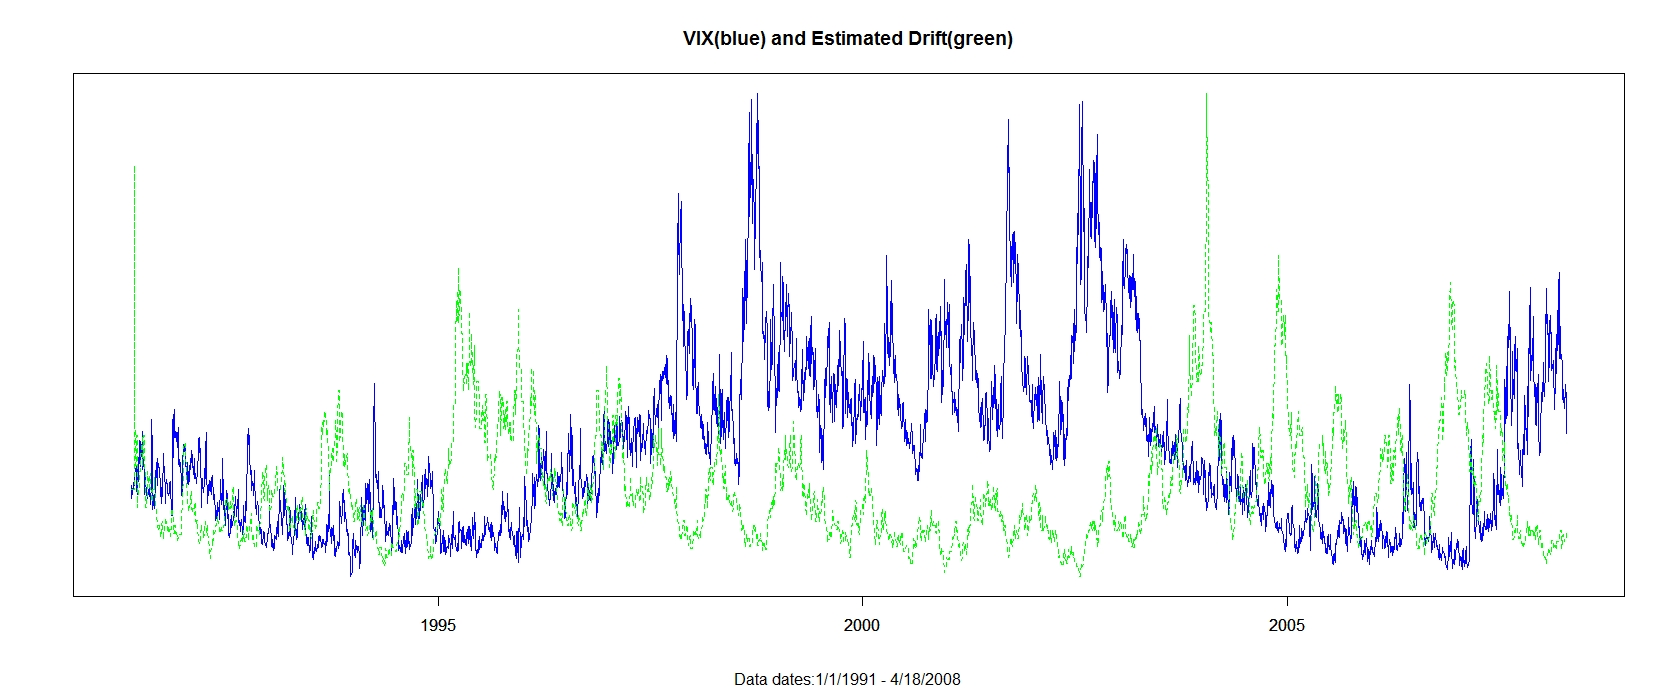
VIX and Estimated Drift, Chart 3
An Idea:
What happens if you buy when Estimated Drift crosses VIX and then exit at an n day high?
A Trading System:
To test this system, I scaled VIX and Estimated Drift from 0 to 1 and then asked what happened after the scaled price series crossed.Conclusion:
if (lastVIX > lastDrift and currVIX < currDrift) thenbuy this bar on close;Results (1991-4/18/2008):
and sell when close > highest close of the last 200 days18/18, 100%, avg 16.5 pts, sd 17.0 pts, z 4.1Looking at the charts, an interesting question is, what happens when VIX crossed Estimated Drift going in the other direction (it looks like a bottom)?
(see Introduction to Testing Trading Systems for more on interpreting these results)
Results for reversed system (1991-4/18/2008):17/17, 100%, avg 24.5 pts, sd 22.0, z 4.6
Either system serves as a general 'all clear' for trading from the long side after a large spike in volatility, can be used to re-activate other systems or as a stand-alone system.


