Playing with Data, 09/17/05
It never hurts to just get out the data, put it in the sandbox and play with it. One never knows what will be discovered and what inspirations will come.
Prompted by a discussion on color on Dr. Niederhoffer's site, here is some sandbox time that resulted in these primitive RGB encodings of the SP using Bonds and the Euro (1996 to present):
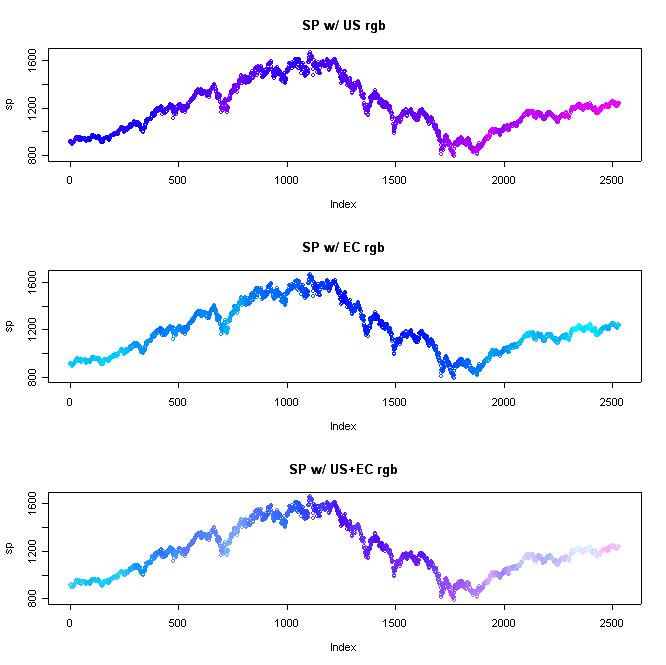
The plots are interesting on their own and as an implementation of the idea that we primarily build systems off of visual data and pushing the frontiers of that visualization will help us build new types of systems.
The plot was produced using the statistics language R. The R code that produced the plots is:
#R RGB
#091705 verticalsolutions v1.0
#takes a vector, returns the vector encoded
#as a 0..255 RGB value
rgbencode<-function(v) {
rgbv<-(v-min(v))/(max(v)-min(v))*255
rgbv<-ifelse(rgbv >=0, rgbv, 0)
return(rgbv)
}
#load some data
#you will need your own data series here
sp<-ADJ$SP1
us<-ADJ$US1
ec<-ADJ$EUR
cl<-ADJ$CL1
#rgb encode
sprgb<-rgbencode(sp)
usrgb<-rgbencode(us)
ecrgb<-rgbencode(ec)
clrgb<-rgbencode(cl)
#some sp plots
par(mfrow=c(3,1))
plot(sp, col=rgb(usrgb,0,255,maxColorValue=255)); title(main="SP w/ US rgb")
plot(sp, col=rgb(0,ecrgb,255,maxColorValue=255)); title(main="SP w/ EC rgb")
plot(sp, col=rgb(usrgb,ecrgb,255,maxColorValue=255)); title(main="SP w/ US+EC rgb")
par(mfrow=c(1,1))