(The Realities of) Adaptive and Fixed Stops in Trading Systems
Below are two examples of stops: adaptive (standard deviation) and fixed (percent) as might be used in trading systems.
The top plot is the distance in points of a 1% stop over time (1993-2009) in the S&P Futures. The bottom plot is the distance in points of a 1 standard deviation stop over the same time period.
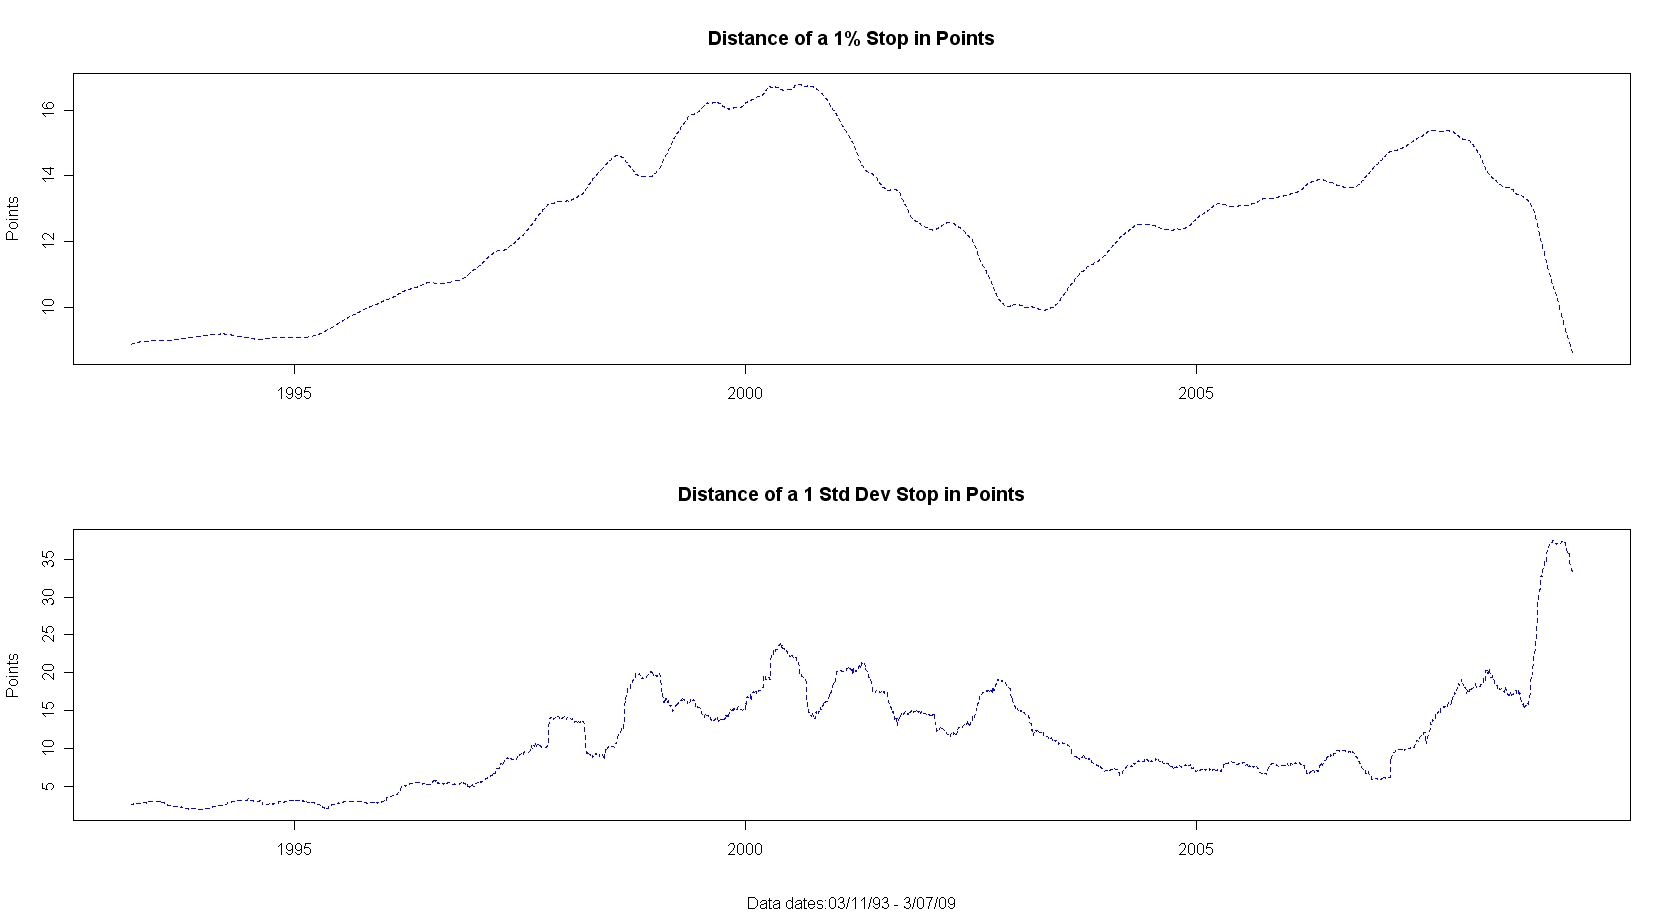
Notice the right side of the charts how the fixed stops (percent) are getting smaller and smaller (too little risk) while the adaptive stops (standard deviation) are getting wider and wider (too much risk).
One solution is to combine adaptive and fixed stops into tiers, using one approach in each tier. Another solution is to recognize the extremes of both adaptive and fixed stops as viability parameters and use them to define operating ranges for the trading system.