The Circular Relationship of Risk and Expecation, 05/21/08
The Circular Relationship of Risk and Expecation
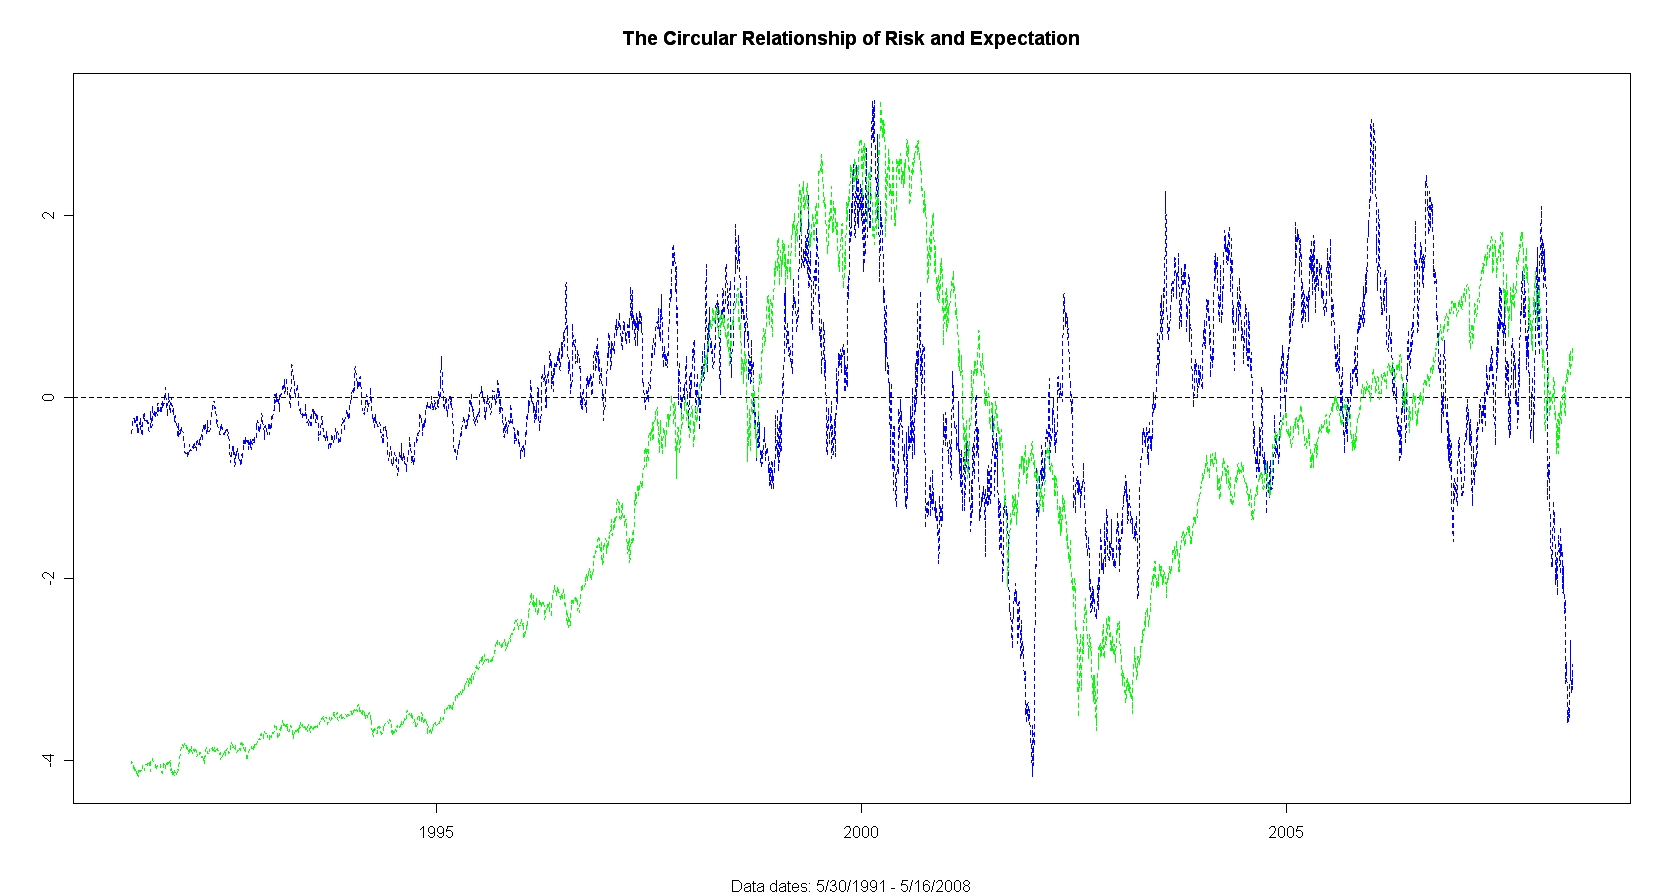
The green line is the adjusted sp futures.
The blue line is an algorithmic forecast of risk in the market. Follow the blue line as it rises into 2000.
It turns out the blue line represents both risk and expectation:
- The absolute level of the blue line forecasts risk with a t of -2.3 (negative sign)
- The relative change forecasts expectation with a t of over 10 (positive sign)