Chart: Post Event Volatility, 08/03/07
During some experiments aimed at adding Optimal f to the Trading System Control Charts I use to monitor and evaluate trading systems, I developed a formulation of Optimal f I call Rolling Optimal f.
Rolling Optimal f was designed to be more responsive to changes in the state of the trading system than optimal f. The difference between Optimal f and Rolling Optimal f is that the win/loss ratio and percentage of wins are calculated from a moving n-trade window in Rolling Optimal f. Here are the two formulations:
Optimal f = (((1 + w/l ratio for all trades) * pct wins for all trades) -1)/(w/l ratio for all trades)The results are here, you can see that Rolling Optimal f is more sensitive to changes in the performance of the system and will make a good addition to the Control Charts:
Rolling Optimal f = (((1 + w/l ratio for last n trades) * pct wins for last n trades) - 1)/(w/l ratio for last n trades)
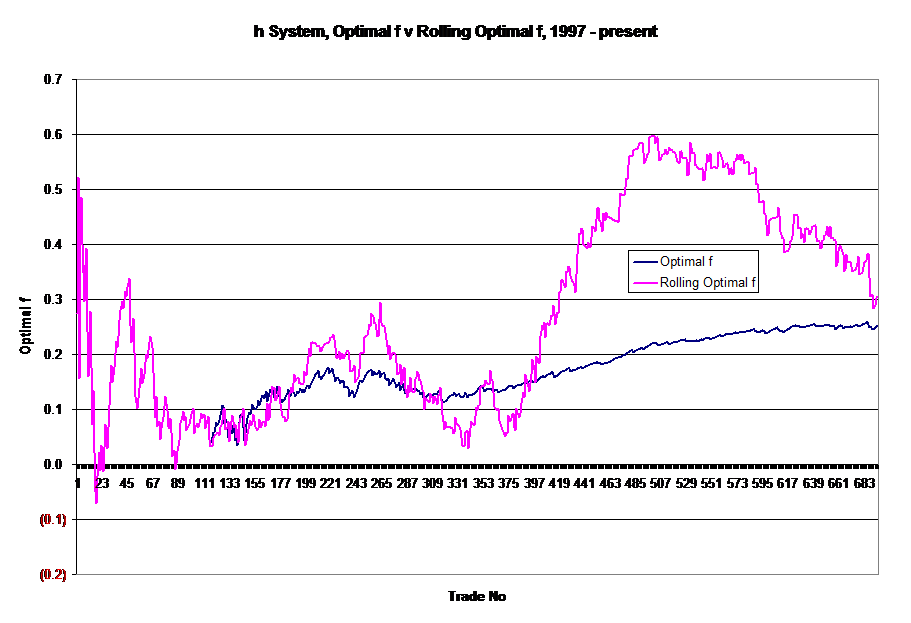
The next question, naturally, is how does Optimal f$, the number of contracts to buy for every n dollars in a trading account compare with Rolling Optimal f$? The answer is here:
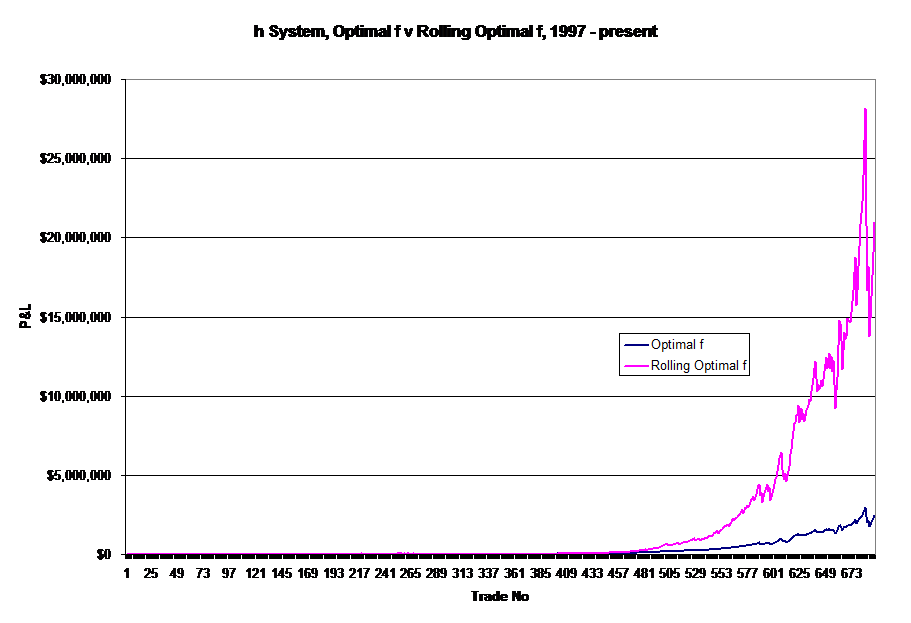
Yes that is a 50% drawdown along the right edge - and a 50% upswing, too. Welcome to Optimal f meets July 2007. Clearly there's more work to be done on the performance side of Rolling Optimal f. Ralph Vince has a new book out, "The Handbook of Portfolio Mathematics" but I didn't find an answer immediately. My suspicion is that Opimal f is a global maximum and Rolling Optimal f is a local maximum and that the out-performance is the result of the local maximum being coupled w/ a very good trading system. On the Trading System Control Charts side, adding Optimal f and Rolling Optimal f will help provide additional context within which to evaluate and monitor trading systems.