P&L Forecasting Part 2, 07/04/08
The P&L forecasting tools have been expanded to work with the two sets of data most readily availableto system developers (average trade and standard deviation of trades) and individual traders(average win, win percentage and win/loss ratio).
The tools are here:
ToolsGiven historical trading statistics from either a trading system or discretionary trading the P&L Forecasters will generate and plot a forecast of the next 100 trading peiods (days, weeks, months, trades, etc.).
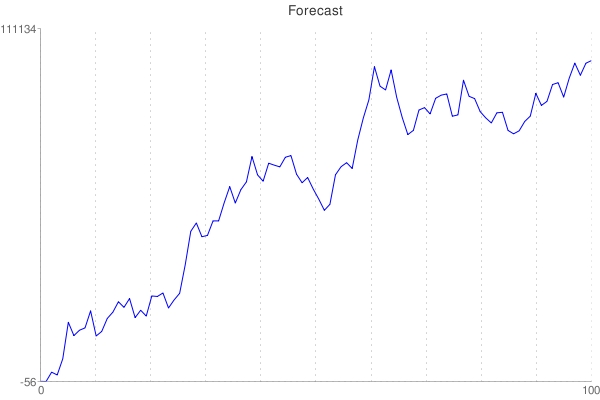
There are three insights to be gained from a forecast (or series of forecasts):
- The journey - the drawdowns and run-ups of the path - is as important as the endpoint
- The slope of the path gives a view to the overall edge
- Varying the trader parameters, which represent the ever-changing cycles of the market, provides some nice insights into what the journey is likely to be like under different market conditions.
The P&L Forecasters add insight and understanding to the life and times of a P&L.
My favorite way to think about trading P&L's and edges is here: The Axiom of the Small Edge.