The Law of Future Expectations, 11/18/05
What is the effect of leverage on control charts?
Moreover, is there a relation between the largest 20 trade P&L drawdown and future expectation?
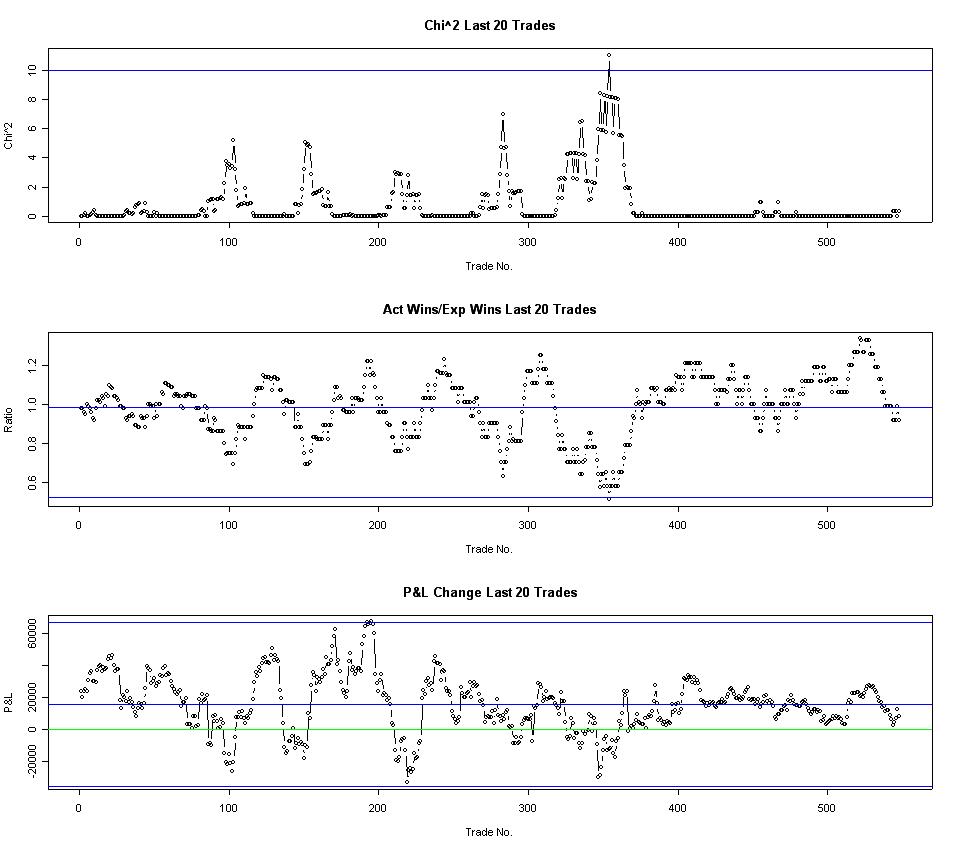
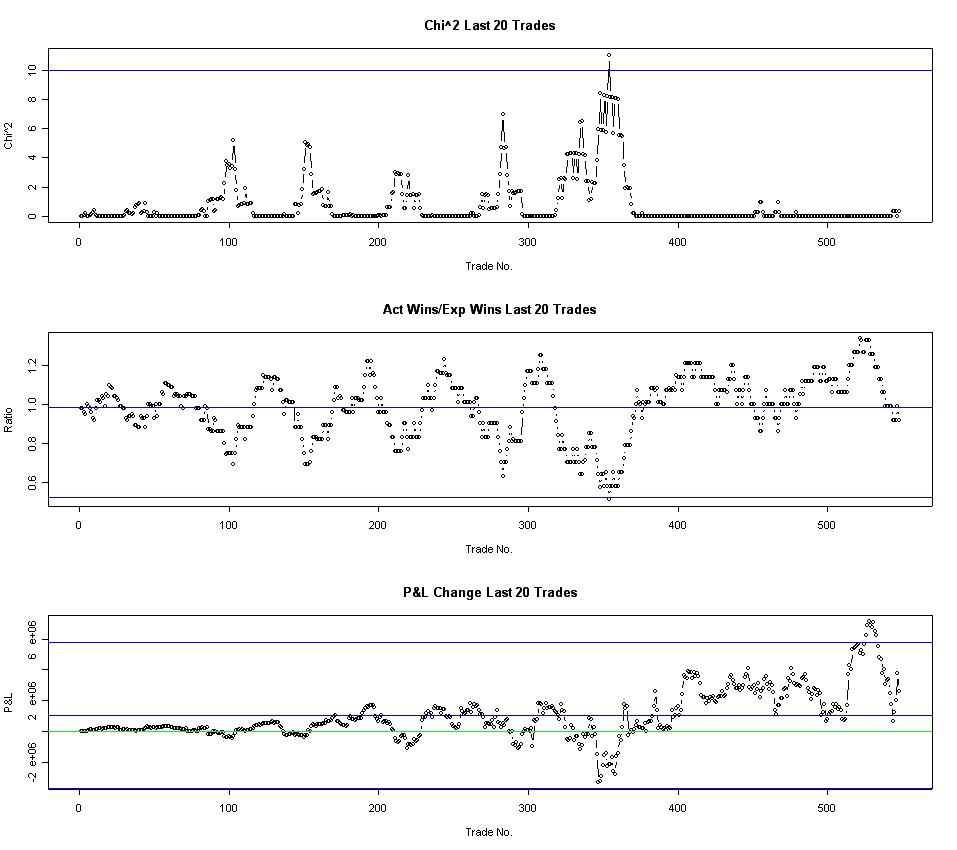
Here are the single contract and optimal f control charts for a sample trading system:
Single Contract
Optimal f
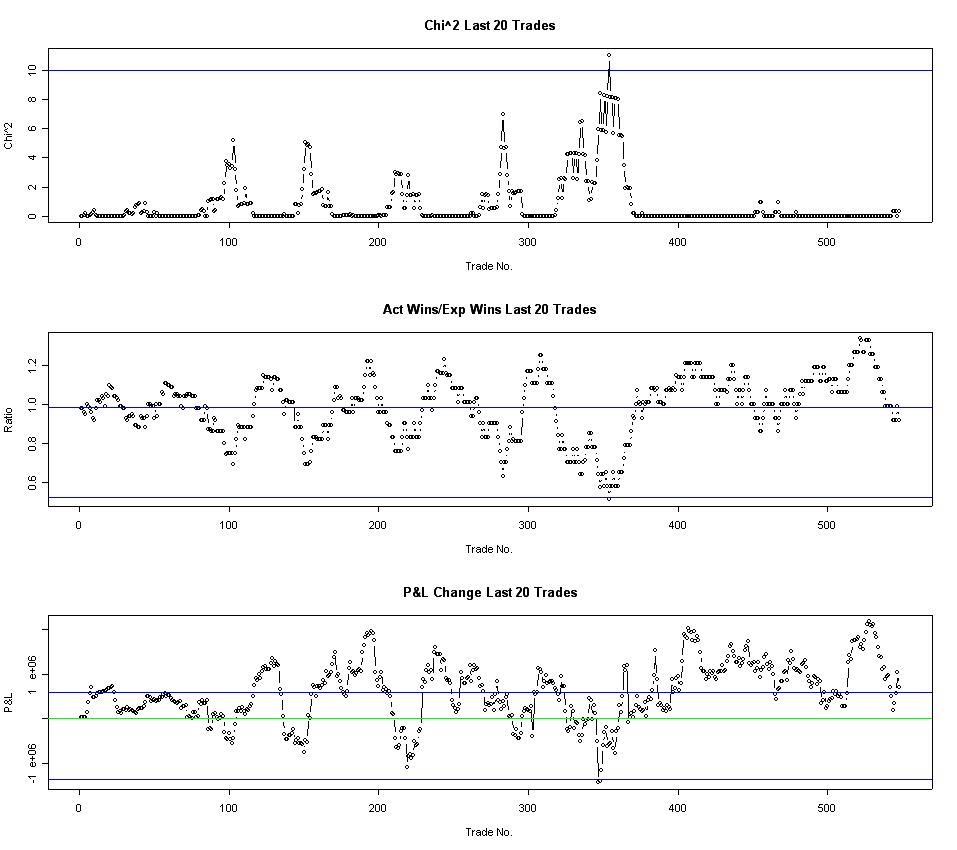
First, note that the Chi^2 and Actual Wins control charts are unchanged and, surprisingly, that the P&L charts are very similar irrespective of scale.
Second, there's the inkling of a 1:1 relation between the largest P&L drawdown and the future average 20 trade P&L.
Here are three more control charts for 1x, 2x and 3x leverage to begin exploring the relation between present drawdown and future average trade:
1x Leverage
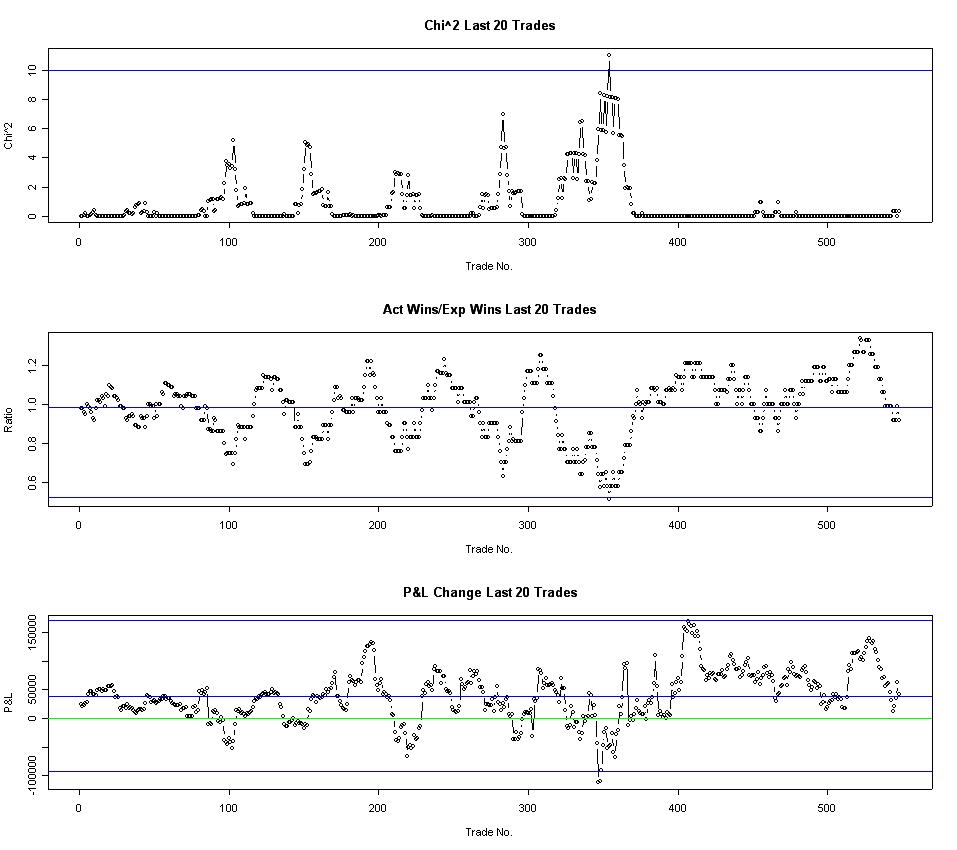
2x Leverage
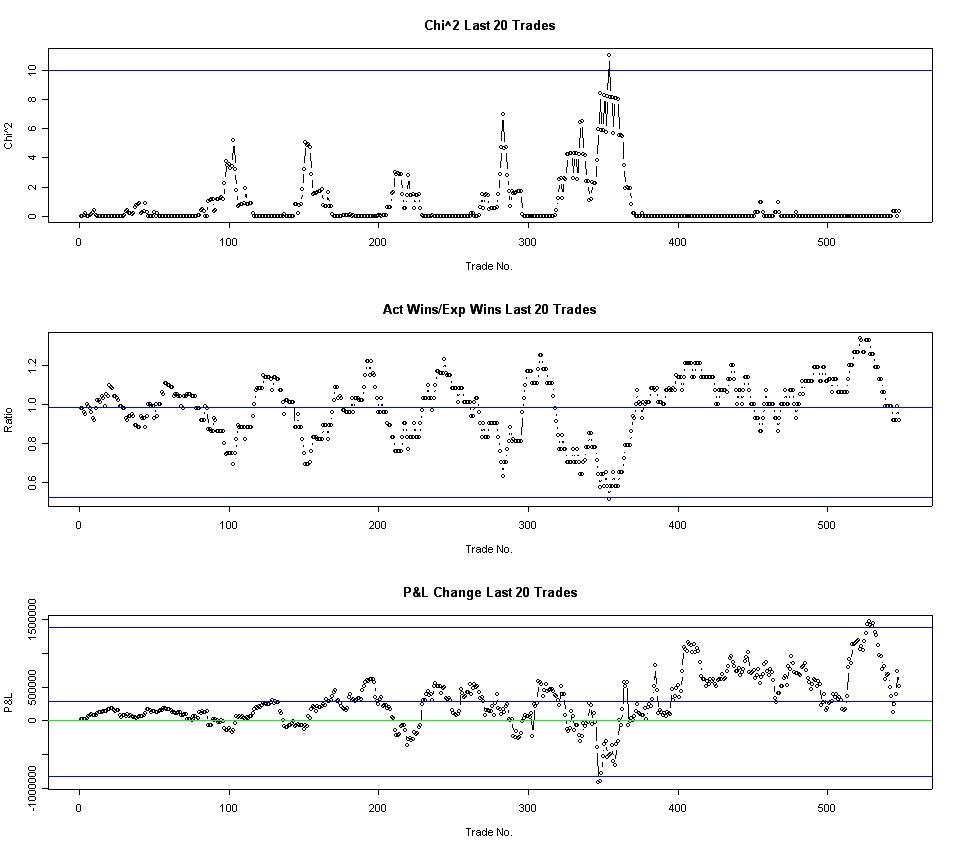
3x Leverage
So we continue to see the control charts are stable with regard to leverage, but more interesting is the hint of a relation between the largest P&L drawdown and average future expectation; the search begins for...
The Law of Future Expectations:
In a cycling system, the future average 20 trade P&L will be the inverse of the largest historic 20 trade P&L drawdown