Expended Energy 2008, 12/22/08
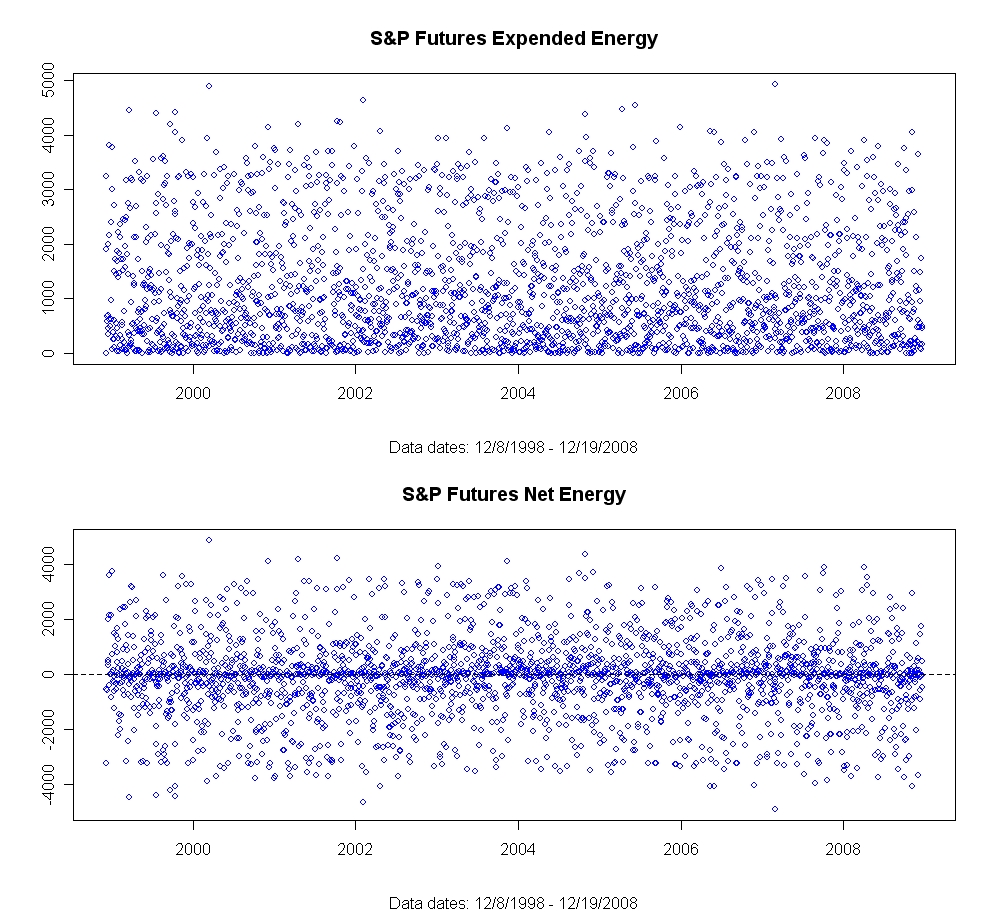
The first charts show the distribution of expended and net energy from 1999 thru 12/19/2008. Note the homogeneity.
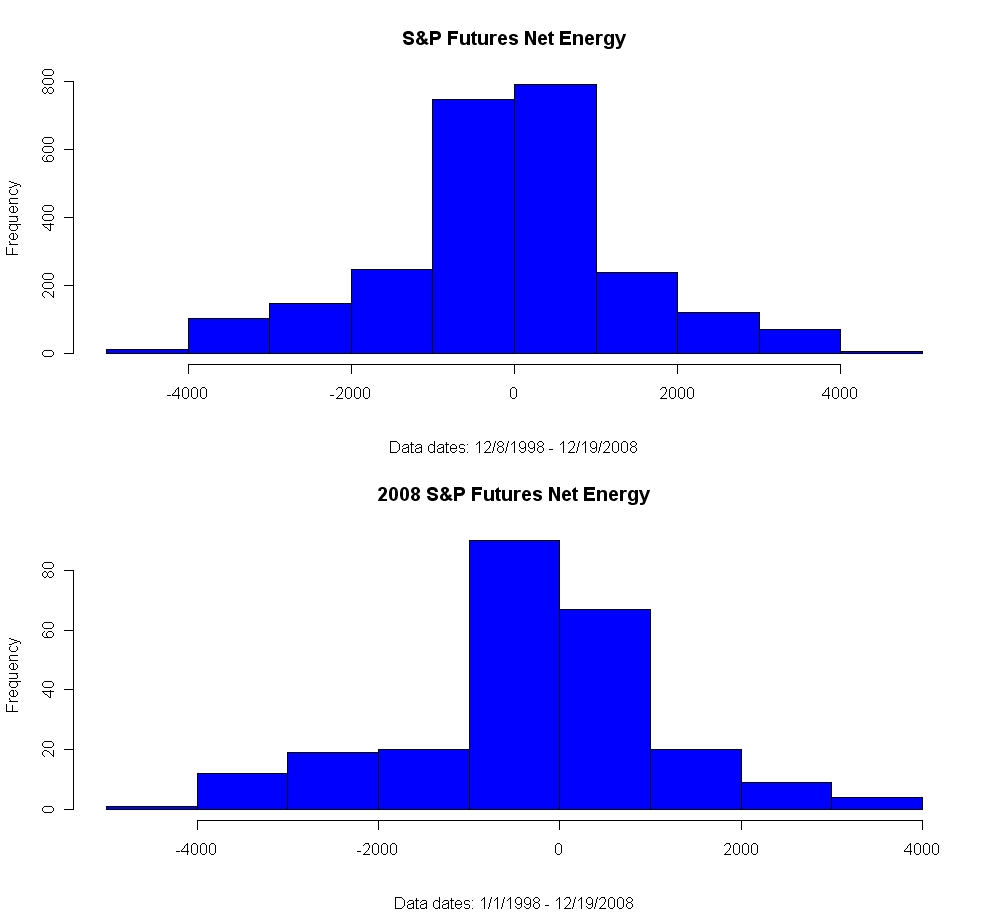
The next charts show how the distribution of net energy in 2008 differed from the distribution of net energy from 1999 thru 12/19/2008 while total expended energy remained relatively constant.