
Evolution of a Buy and Hold Model, 06/18/11
As a natural offshoot of 'Does this trading system or portfolio of trading systems beat buy and hold?' - trading system designers naturally come up w/ all sorts of longer term models. Such models can be useful as environmental indicators, shut-off valves (if this then turn my trading systems on/off), or can evolve into actual long term trading systems. Below are three long term models that illustrate.
All trades SP 500 cash index.
Model 0:
Buy and Hold baseline. Buy January of 1997. Hold. (2010-2011 shown)
Statistics (1/3/1997 - 6/17/2011):Model 1:Simple return (annual): 5.02%
Max drawdown (peak equity to equity trough): -57.6%
Time in market: 100%
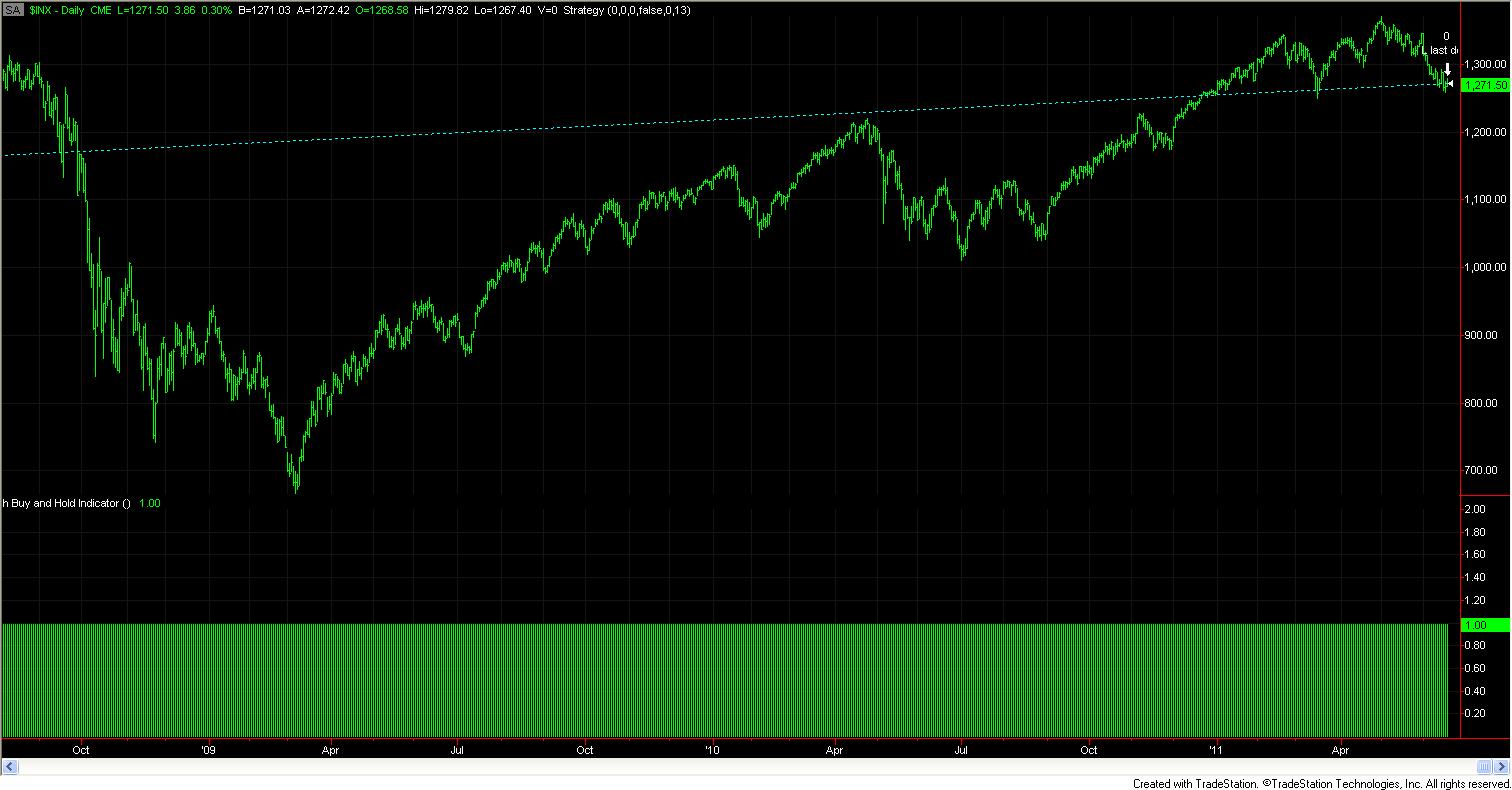
This was my first long term model and I still use it to tell me when to turn swing and multiday trading systems on and off. This model measures a ratio of up days to down days and when the ratio is bullish the long side models are 'on' and when the ratio was bearish the long models are 'off'.
The chart is the SP cash from 1997-p. The indicator at the bottom of the chart is green when the ratio is greater than one and red when the ratio is less than one. One rule. Very simple. Be long when the ratio is greater than 1.
Statistics (1/3/1997 - 6/17/2011), it is an average buy and hold model:Model 2:Simple return (annual): 8.38%
Max drawdown (peak equity to equity trough): -36.1%
Time in market: 75.5%
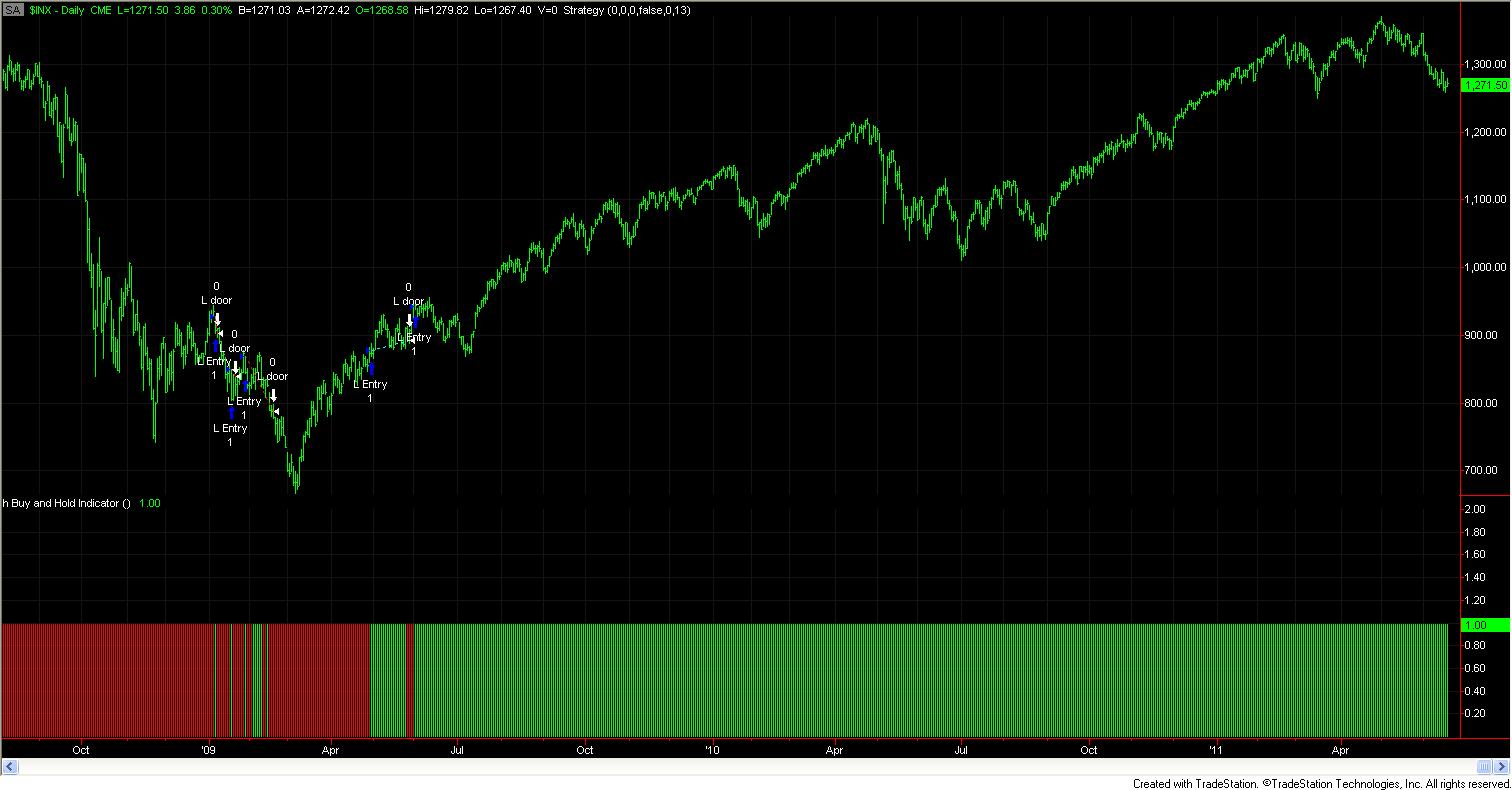
This was my second long term model. It came about when I was trying to figure out when a change in intraday oscillators would occur. I ended up calling it Door Number 3 after the Monte Hall problem. The idea is that there is an edge to long side trading systems when this indicator is green.
The chart is the SP cash from 1997-p. The indicator at the bottom of the chart is green when the model is long, red when the model is flat. One rule, i.e., one moving part.
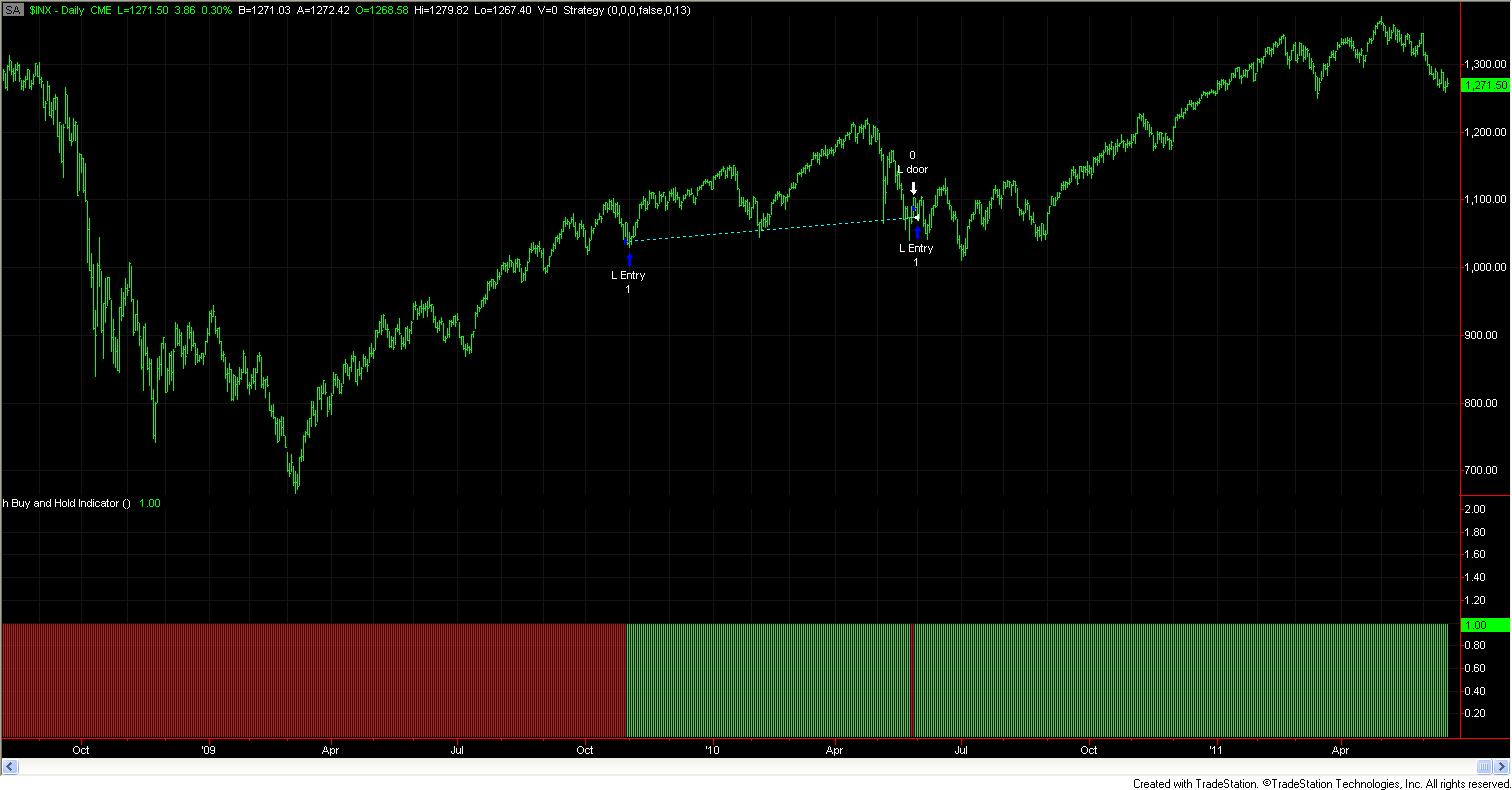
Statistics (1/3/1997 - 6/17/2011), this is an above average buy and hold model:Model 3: This is the latest long term model. Someone asked me a question, which led to some numbers, which led to a 'that's interesting' which got combined w/ some old numbers and an idea. Three rules this time, so three times as complex as models 1 and 2.Simple return (annual): 10.63%
Max drawdown (peak equity to equity trough): -20.4%
Time in market: 67.79%
The chart is the SP cash from 1997-p. The indicator at the bottom of the chart is green when the model shows a long side edge.
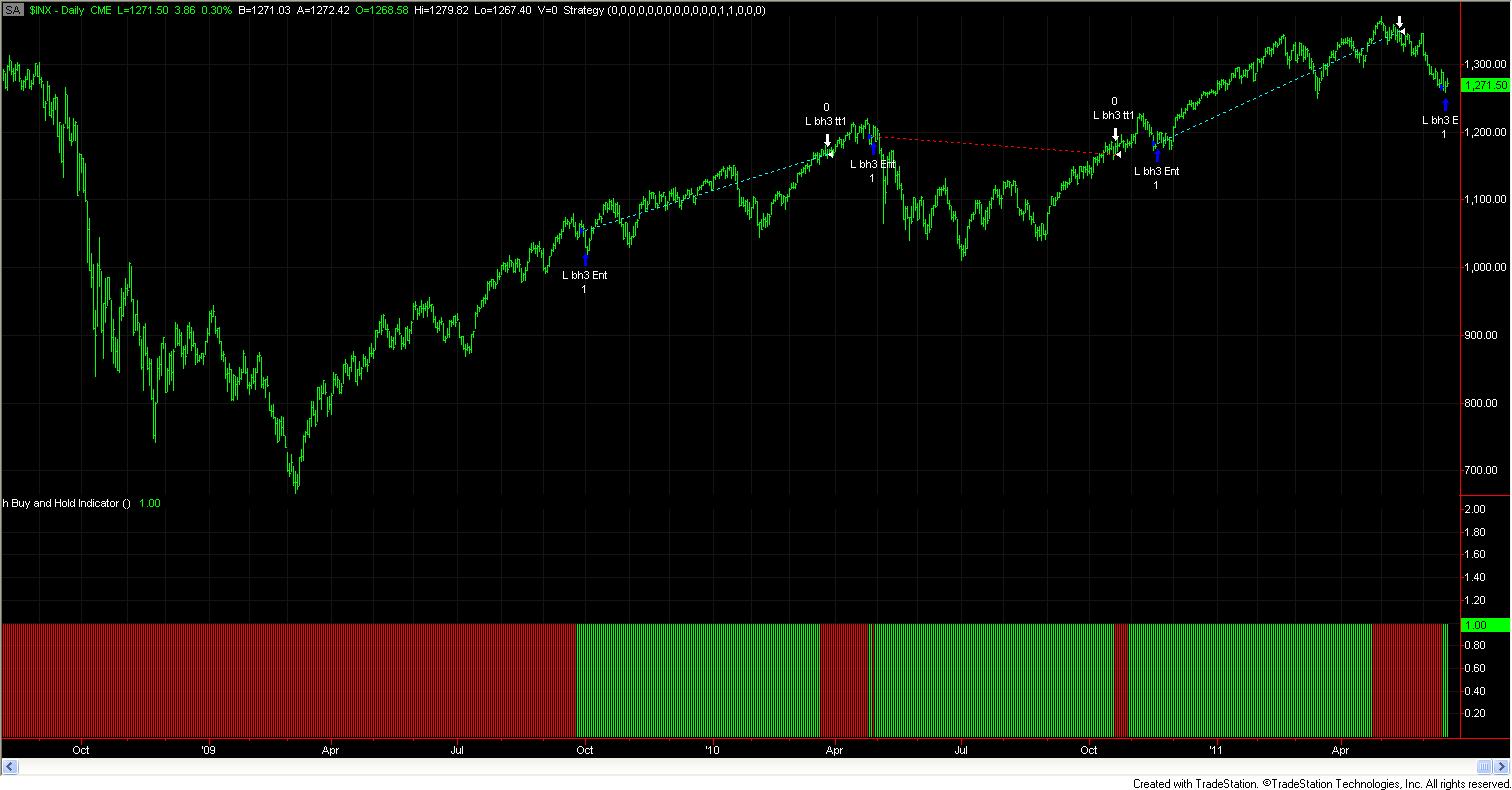
Statistics (1/3/1997 - 6/17/2011), this is a very good buy and hold model:Simple return (annual): 10.17%This model is in the market only 36% of the time so there is a huge amount of room for creatively filling the 'risk free' side of the trade.
Max drawdown (peak equity to equity trough): -18.0%
Time in market: 36.03%
Conclusion
What really happened above was evolution. The final result is very simple but still has three times as many rules as models 1 and 2. The whole process took about 5 years of continuous improvement. What isn't shown are all the ideas that didn't work - hundreds of them - that helped evolve Model 1 to Model 3. Continuous incremental improvement has always worked well for me.