Cycle Accumulator, 01/30/07
Two charts comparing monthly buy and hold with accumulating based on the eight month cycle shown and discussed here.
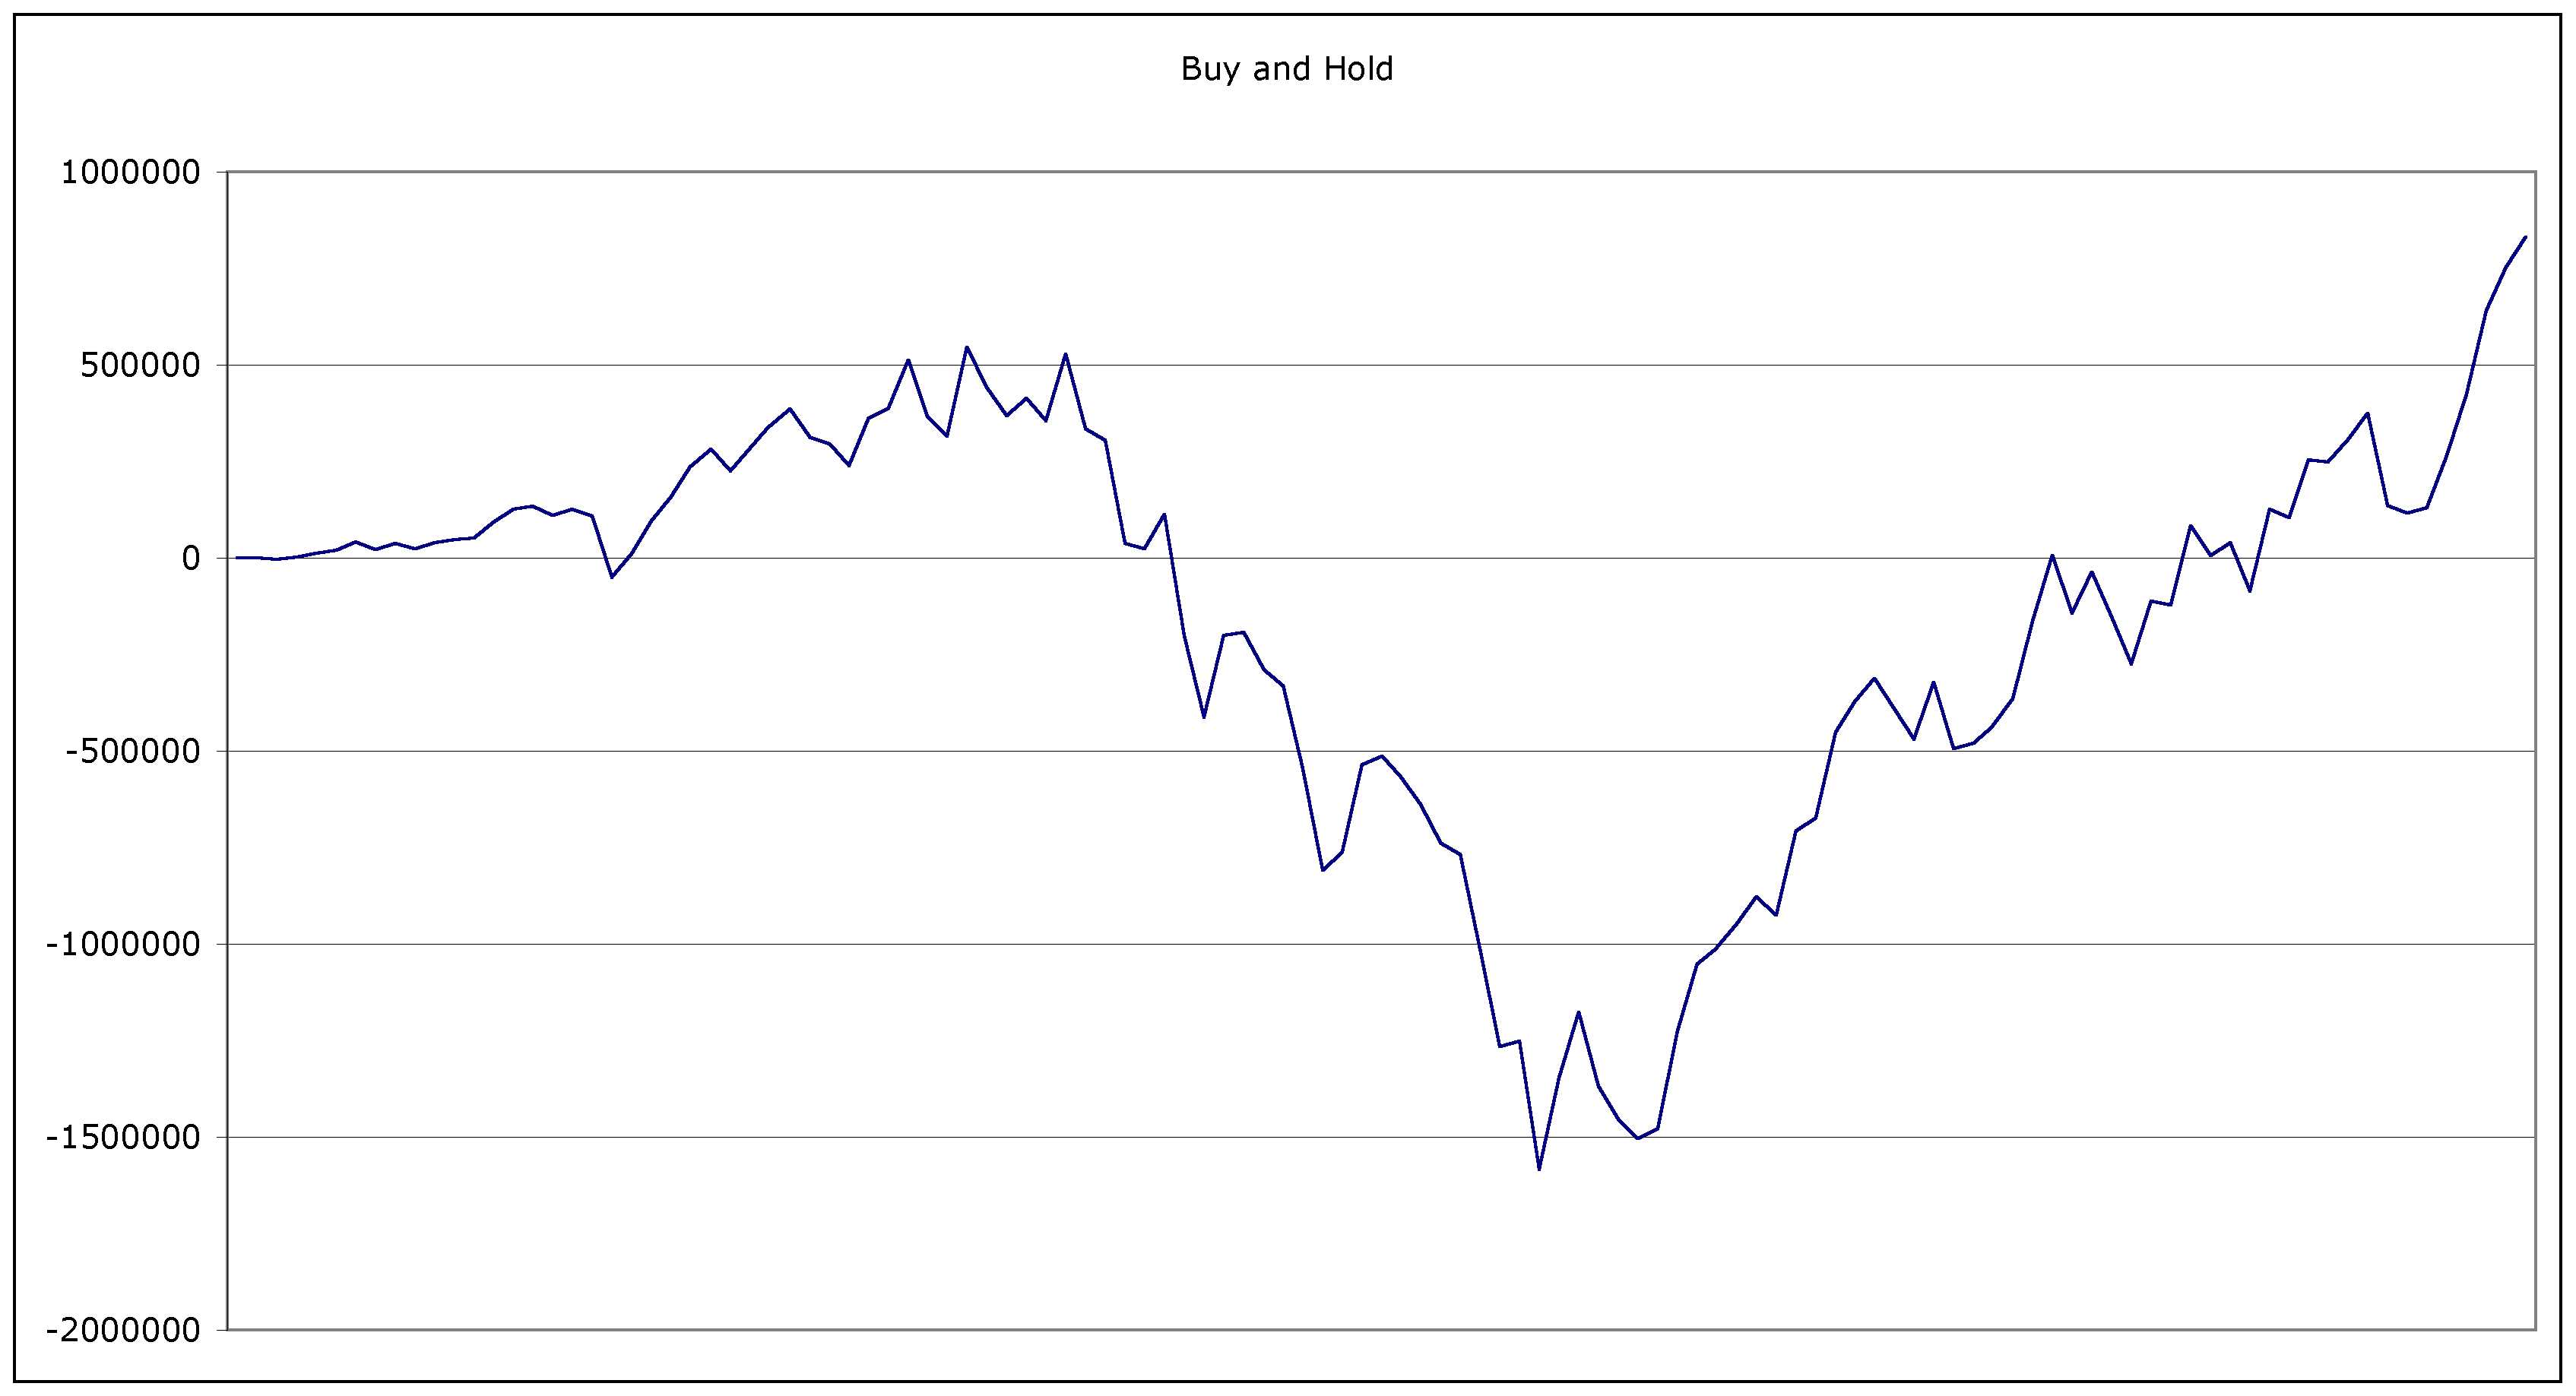
The charts cover the period from 1997 thru 2006. The first chart shows the result of buying a single SP e-mini contract on the last trading day of each month and holding it.
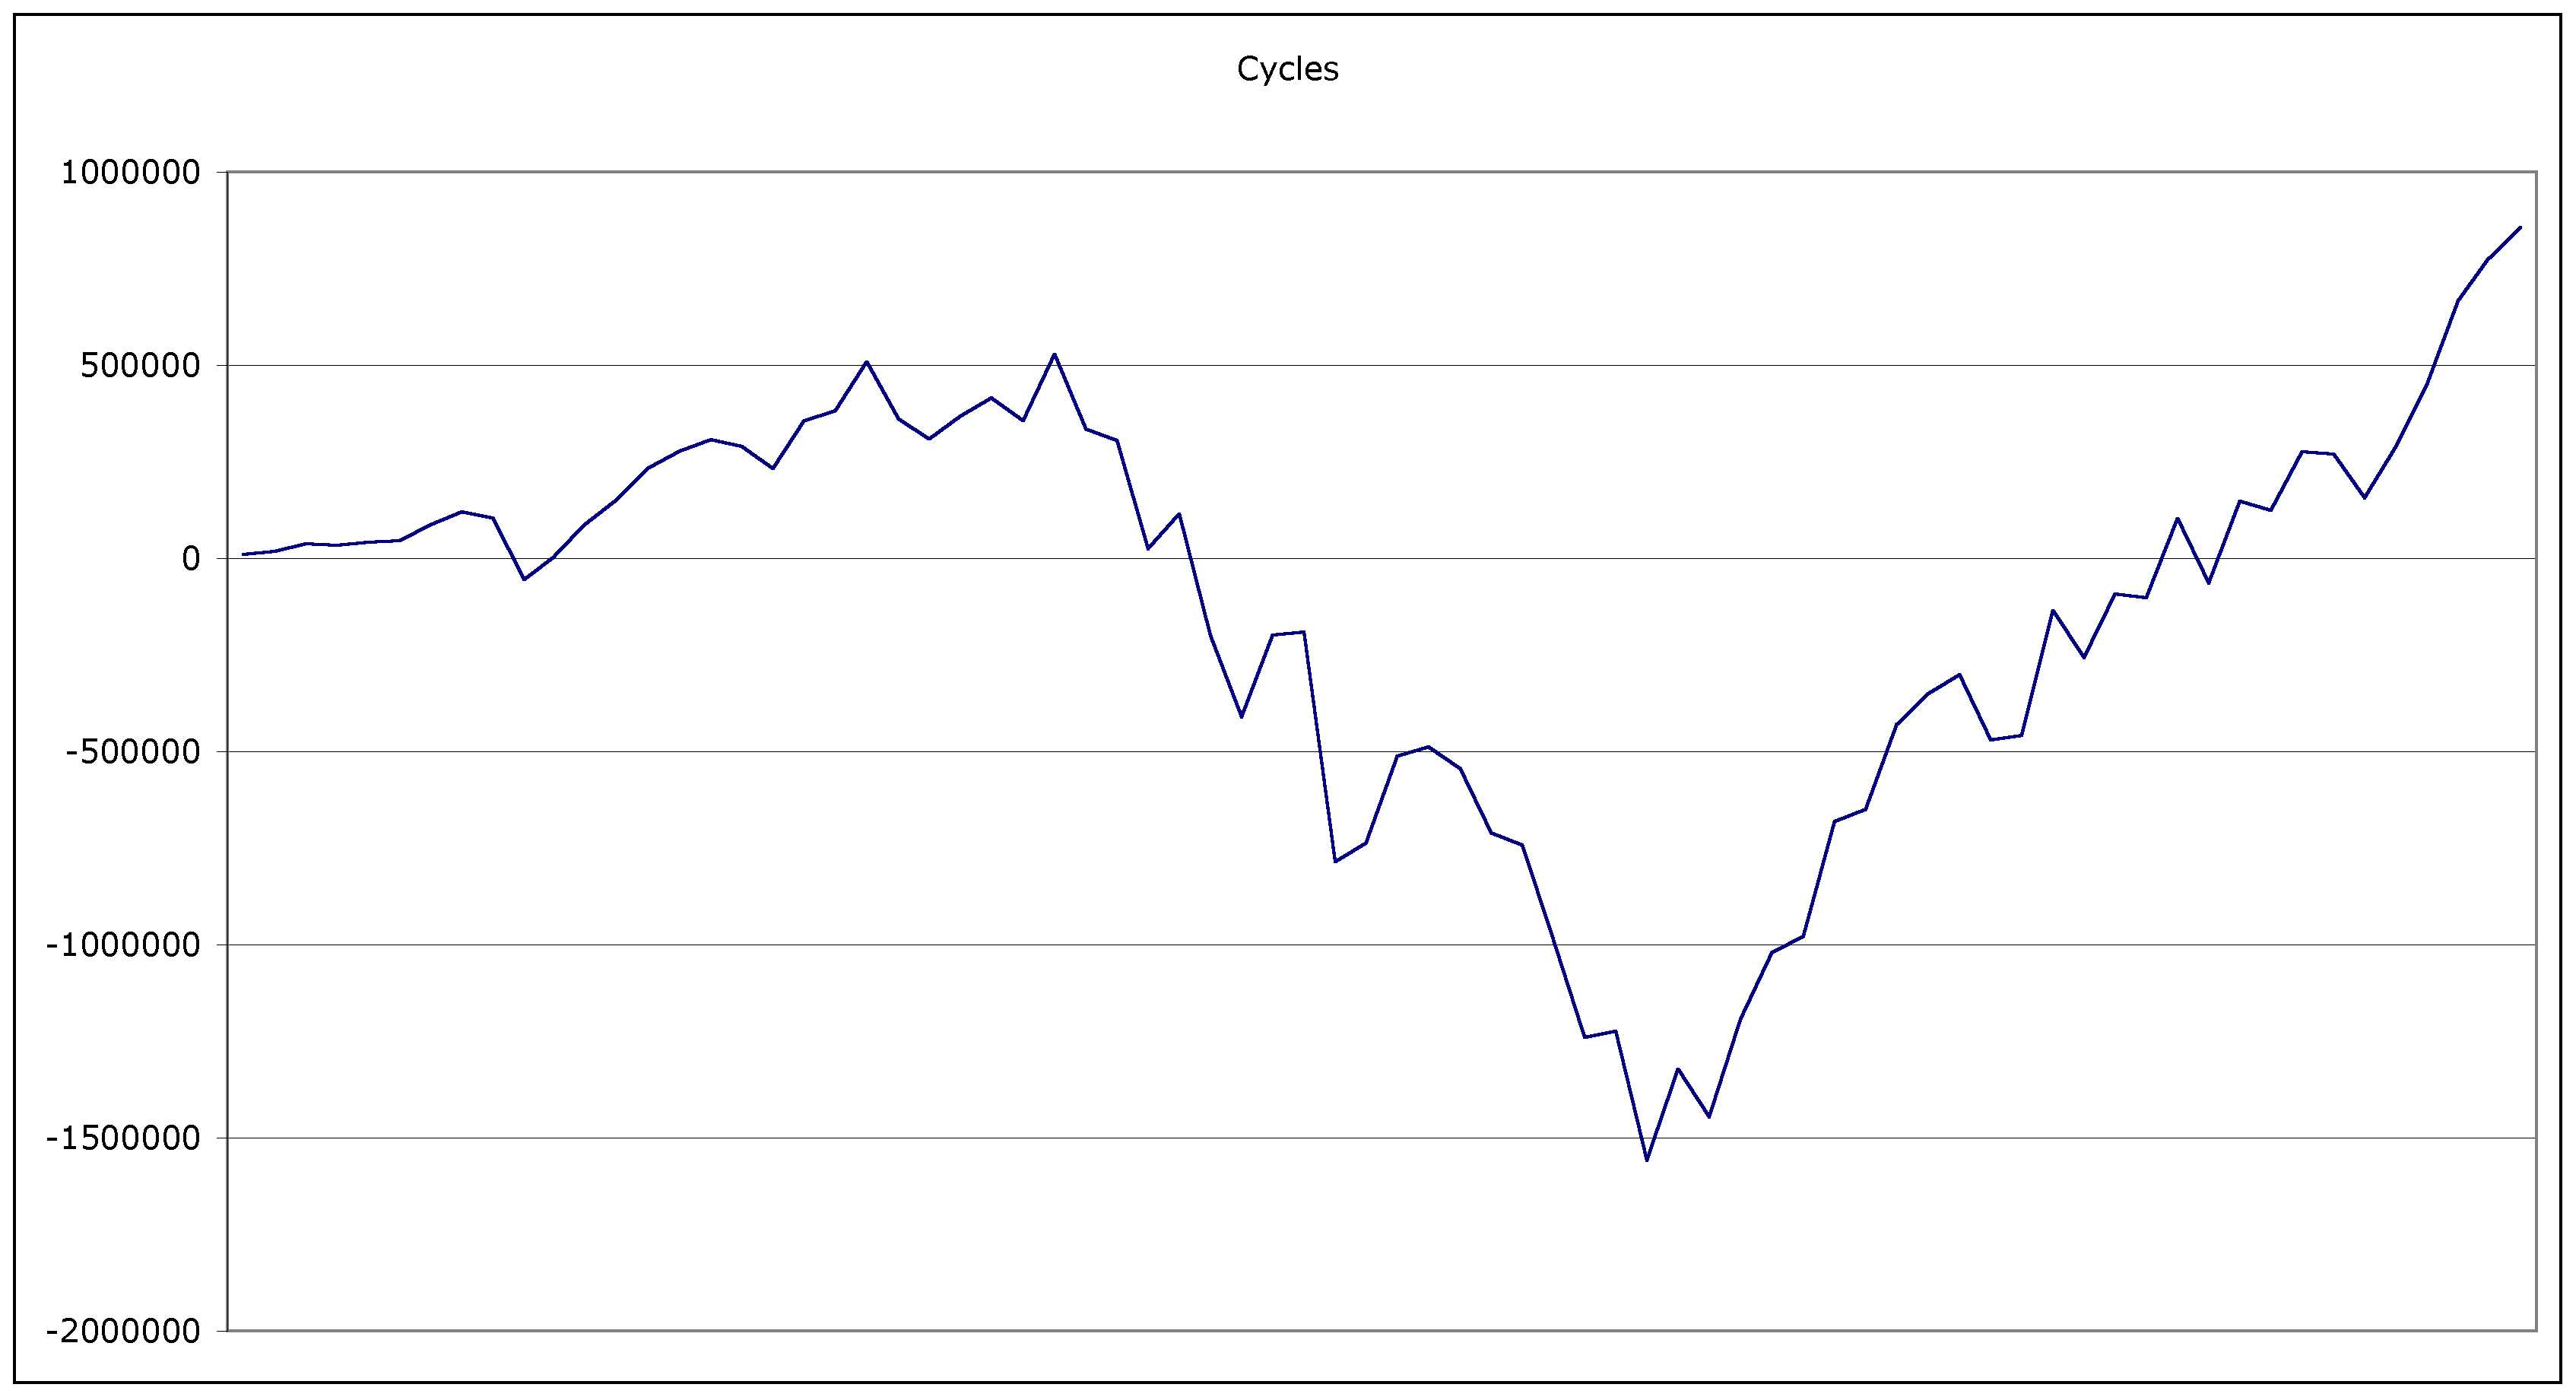
The second chart shows the result of buying a single e-mini contract on the last trading day of each month if the market was at a cycle low or in the four months following the cycle low. Cycle lows were identified programmatically. Contracts not in this period were accumulated and purchased with the first in-cycle purchase.
As the charts show, the ending average price was nearly identical for buy and hold vs the Cycle Accumulator with the cycle accumulator eeking out about a 0.5% edge, 1287.67 vs 1280.91. Equity highs and lows were similarly close.
Buy and hold remains a worthy benchmark.