Control Charts and System Forecasting, 01/20/08
Control charts can be used to monitor and predict the future performance of trading systems.
In the example below, we can watch an actual trading system begin to fail. Chi^2 is spiking showing that results are becoming less stable, the ratio of wins to expected wins is trailing off and the profitability is trending down. All early warnings of a system in trouble.
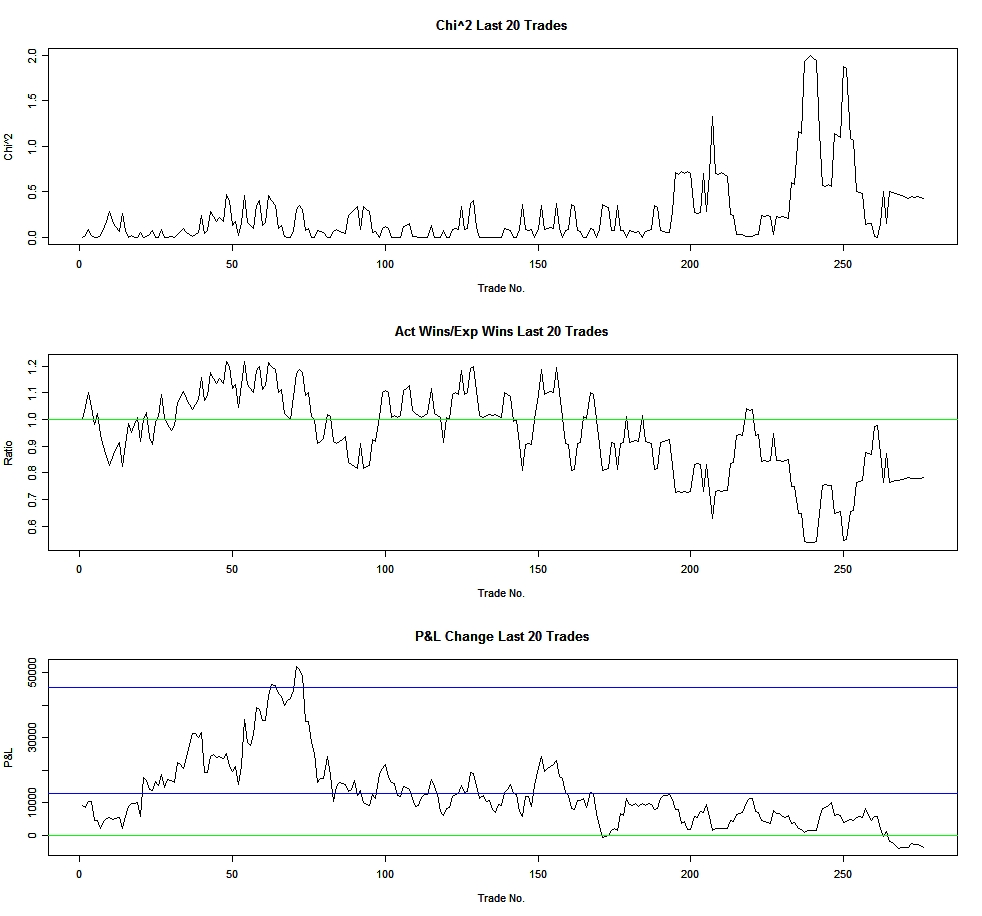
There are two options when faced with a trading system that is failing: fix it or throw it away. Since the system above is an old friend, I opted for fix:
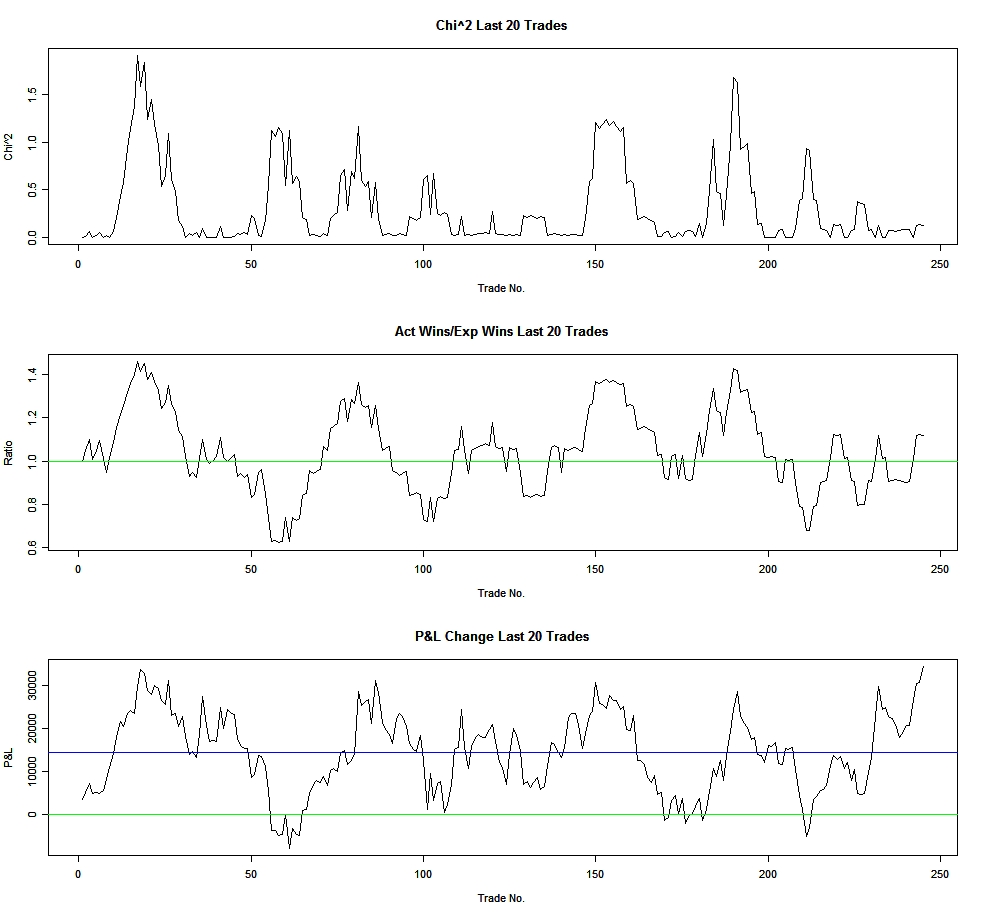
One interesting note is the cyclicality of the new system - something that does not show up in its other charts and statistics - I'll have to work on this. Ralph Vince has a method for working with cycles in The Handbook of Portfolio Mathematics; sadly, I can't find the page right now.
[01/21/08 hac - pages 27-41. I'm reminded just how indispensable this book is.]