Evaluating Systems with Control Charts, 05/29/08
Below are the Control Charts for two versions of the same system.
The system versions have nearly identical t scores and optimal f values and differ only in the depth of the stops they use. (See Introduction to Testing Trading Systems)
Control charts can be used to compare the versions of the system and evaluate which version to trade.There are three plots for each system and each plot gives insight into the stability of the system over time.
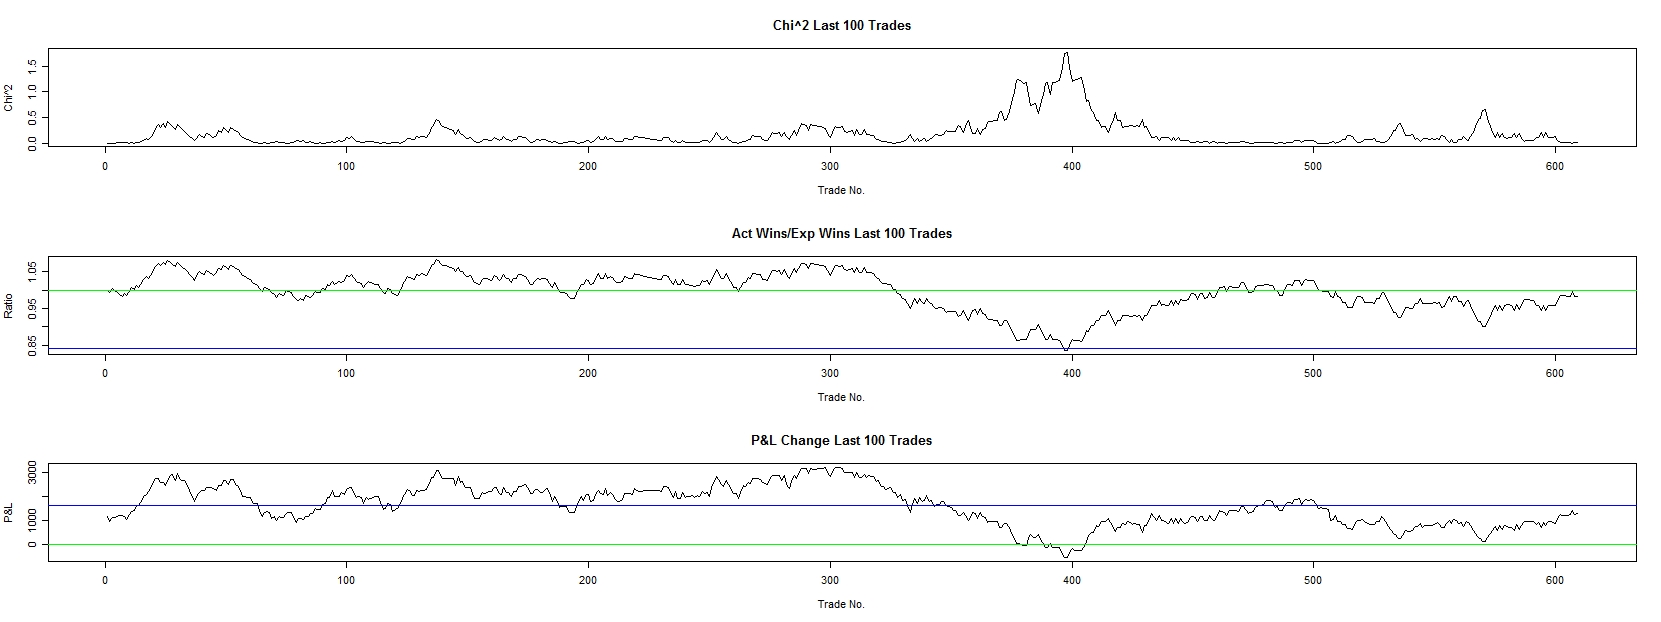
Control Charts of System Version 1
Control Charts of System Version 2
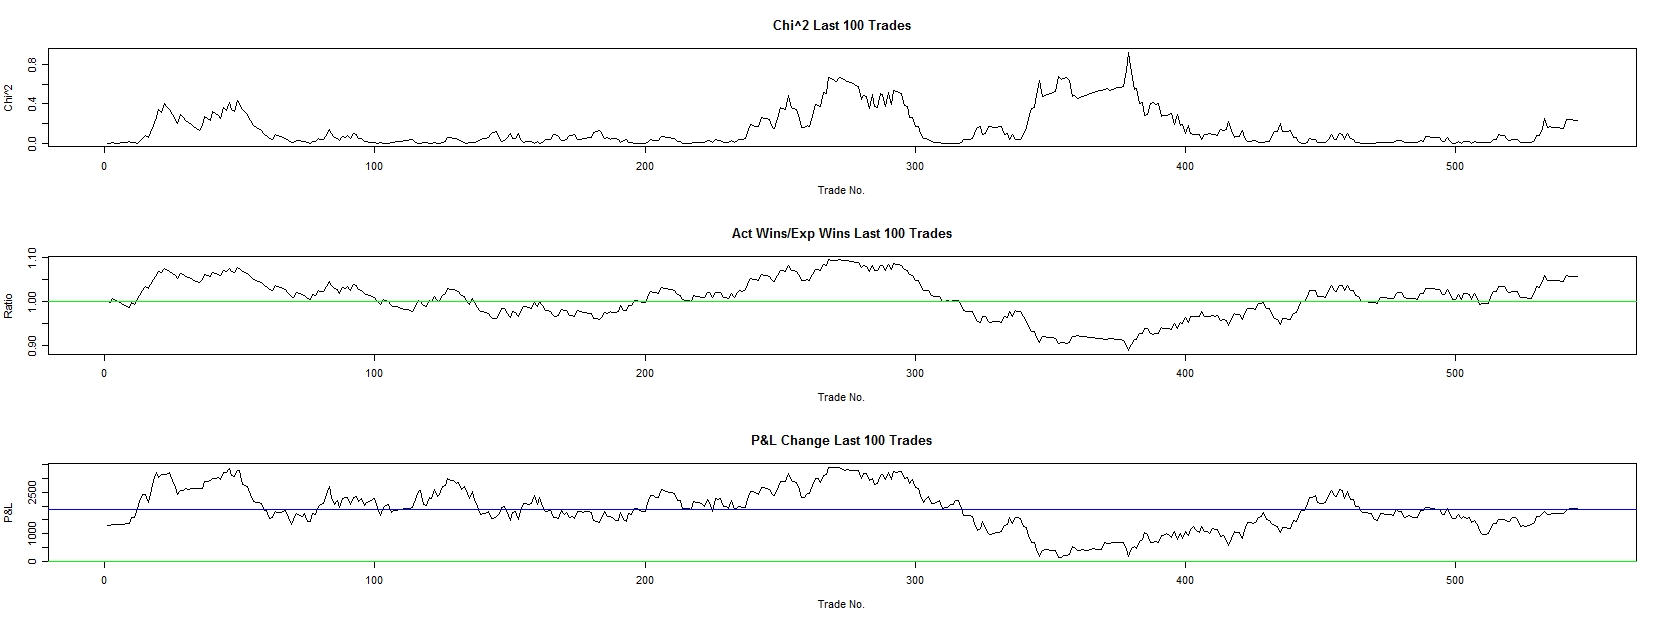
The lower set of plots representing version 2 of the system, has a bit more stable Chi^2 plot (upper plot), a more stable ratio of actual to expected wins (middle plot), and, finally, a more stable P&L curve (lower plot).
All things being equal, version 2 is the better incarnation of the system.