Volatility Stress
The following ideas have not been tested.
Volatility Stress should behave similarly to Market Stress.
Red shows volatility under increasing stress with reversal likely. Blue no stress.
The more markets that are red, the higher the likelihood of a risk event (correlation/trending)
Think of the columns as volatility risk thermometers and the rows as volatility correlation indicators.
Higher Frequency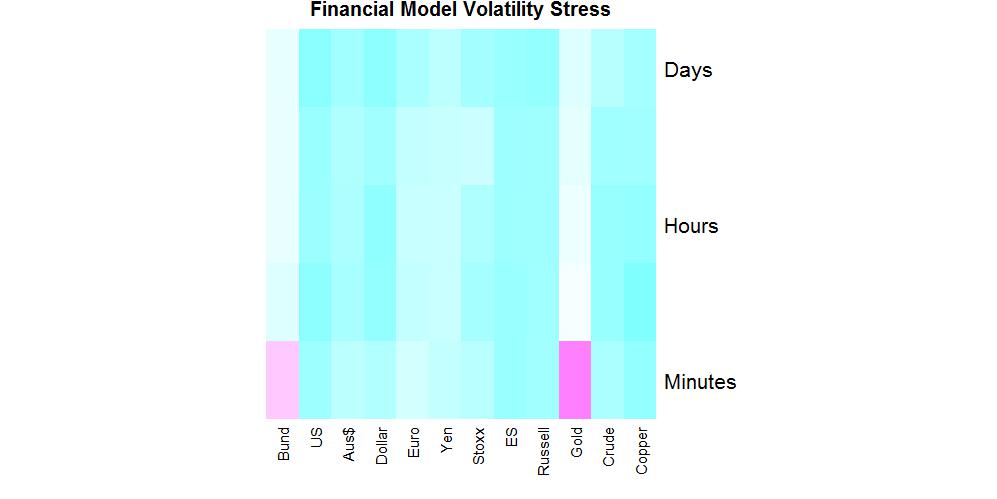
|
Lower Frequency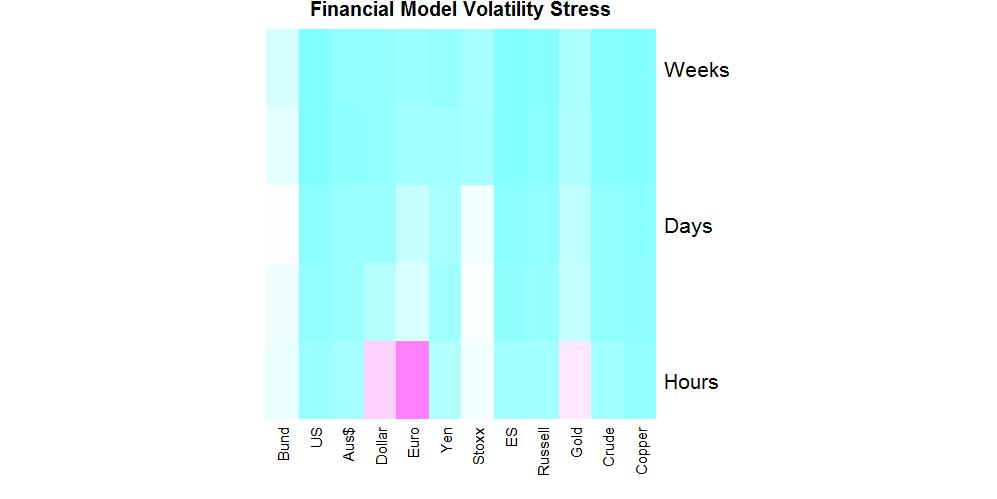
|
Live tables updated every 10 minutes