Trend Day or Range Day?
Click the dashboard buttons for charts that help determine if today is a Trend Day or Range Day in US Equities. Charts are updated every 5 minutes during the trading day.|
|
This chart forecasts the current odds that today is a trend day in US equities. A reading of '20%' means there is a 20%
chance that today will be a trend day.
A trend day is a day where prices generally move in a single direction, there is range expansion and prices end at one extreme of the range. Readings are based on a generalization of the algorithms in our Automated S&P Trading Strategy. This chart is found in the "Forecast" dashboard. |
|
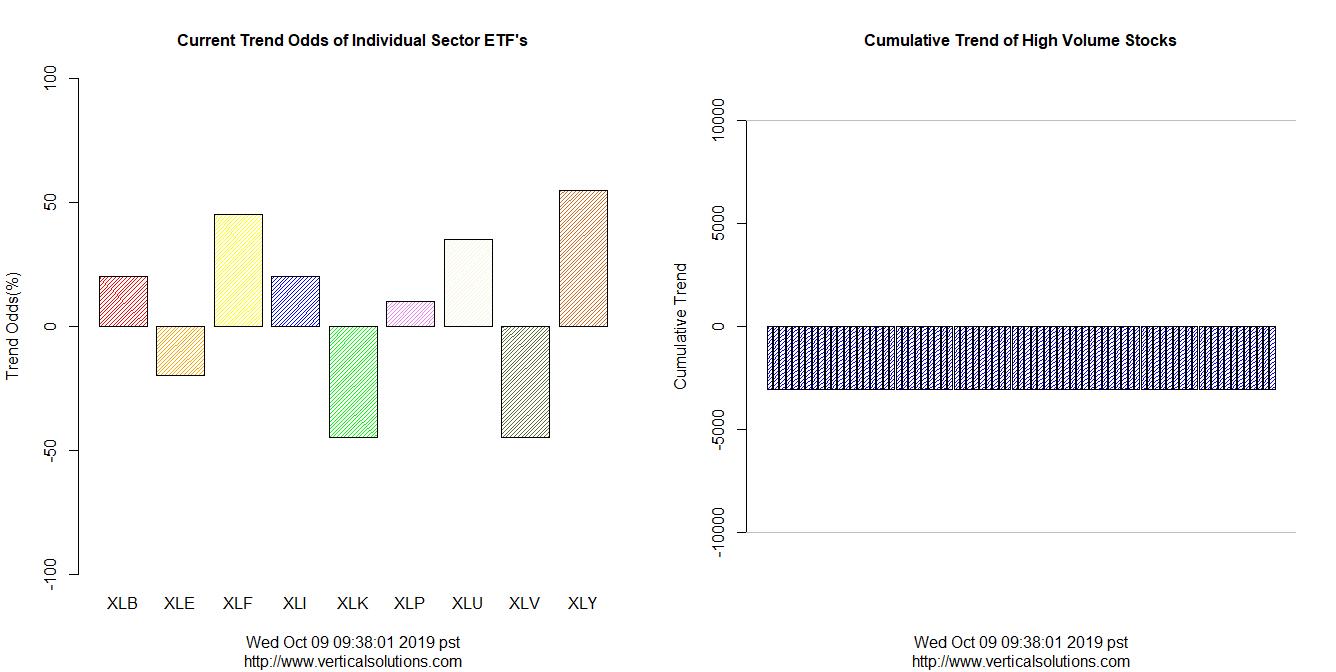
The first of these two charts show the current trend odds of each of the 9 Sector ETF's. The second chart
shows the cumulative trend of 250 individual high volume stocks. Readings over 10,000 indicate a strong trend
while readings below 2300 indicate a range day.
These charts are found in the "Current Conditions" dashboard. |
|
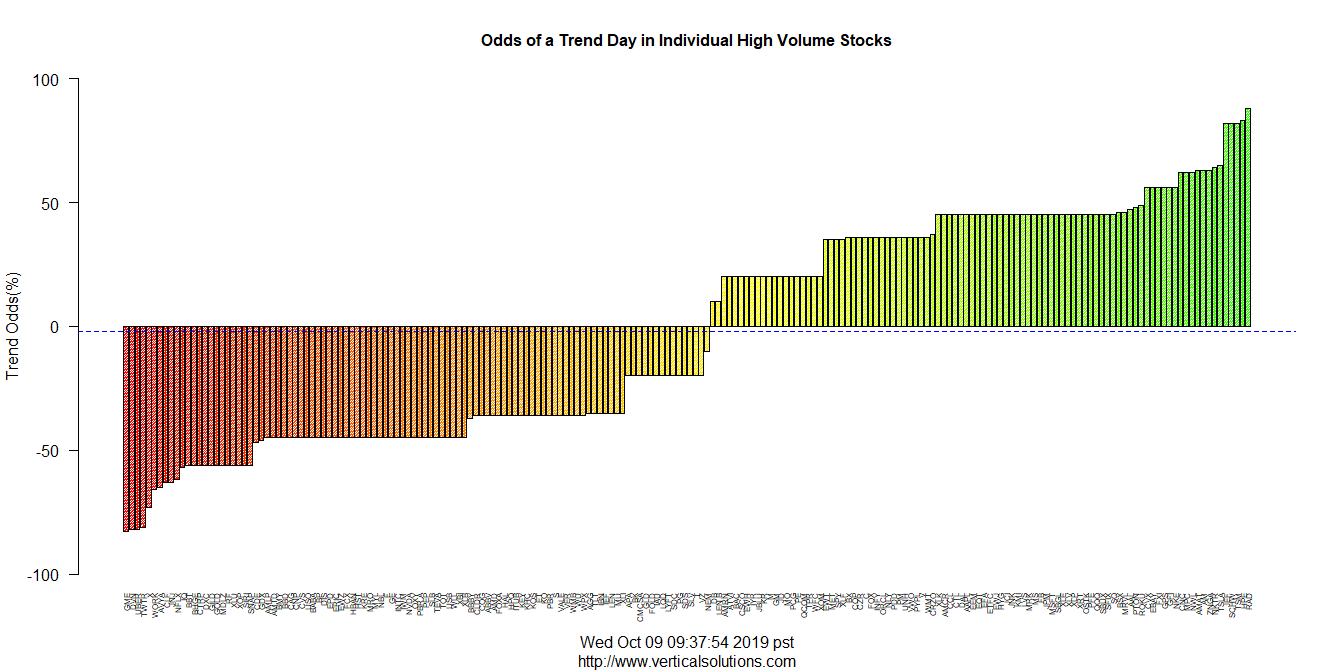
This chart shows the individual trend odds of 250 high volume stocks. Distributions skewed heavily in one direction
indicate trend days while evenly distributed trends indicate range days.
This chart is found in the "Individual Trends of High Volume Stocks" dashboard. |

|
This table lists current pairs of stocks with the highest odds of trending. Each stock trending up is paired with
a stock trending down. The stocks are from the list of 250 highest volume stocks over $5 in US equities.
This table is found in the "Pairs" dashboard. Image compliments of Jorge Sarvise - thank-you Jorge! |